Fig. 1.
Download original image
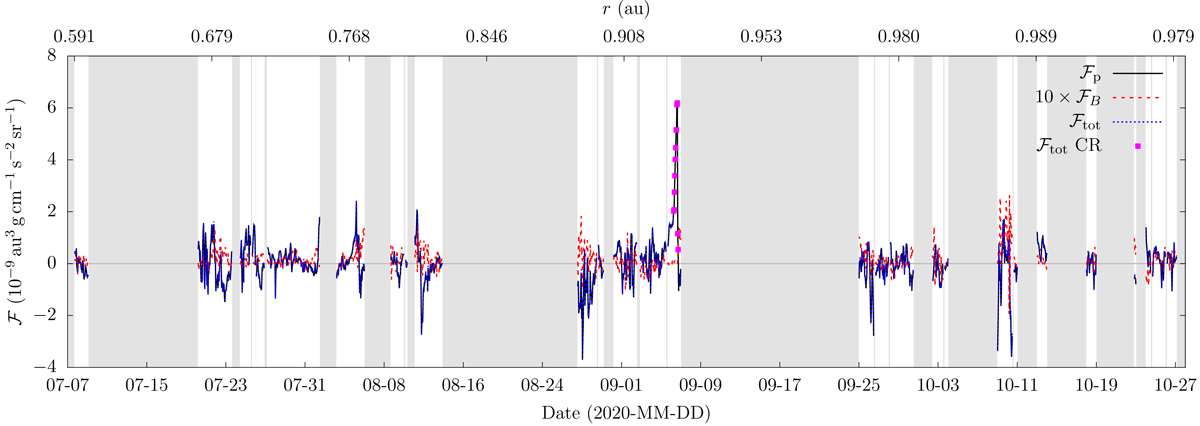
Time series of the angular-momentum flux per solid-angle element measured during Solar Orbiter’s first orbit of the cruise phase. The diagram shows the proton contribution ℱp, the magnetic-field contribution ℱB, and the sum of both, ℱtot. In order to increase the visibility, we multiply ℱB with a factor 10. The magenta squares represent the measurements of ℱtot during the time of the compression region (CR) on 2020-09-06. The axis at the top indicates the heliocentric distance of the spacecraft at the time of the measurement. The scale of this axis is not linear. The grey-shaded areas indicate times for which our merged SWA/PAS-MAG data product is unavailable or the data flags for either dataset indicate poor data quality.
Current usage metrics show cumulative count of Article Views (full-text article views including HTML views, PDF and ePub downloads, according to the available data) and Abstracts Views on Vision4Press platform.
Data correspond to usage on the plateform after 2015. The current usage metrics is available 48-96 hours after online publication and is updated daily on week days.
Initial download of the metrics may take a while.