Fig. 3.
Download original image
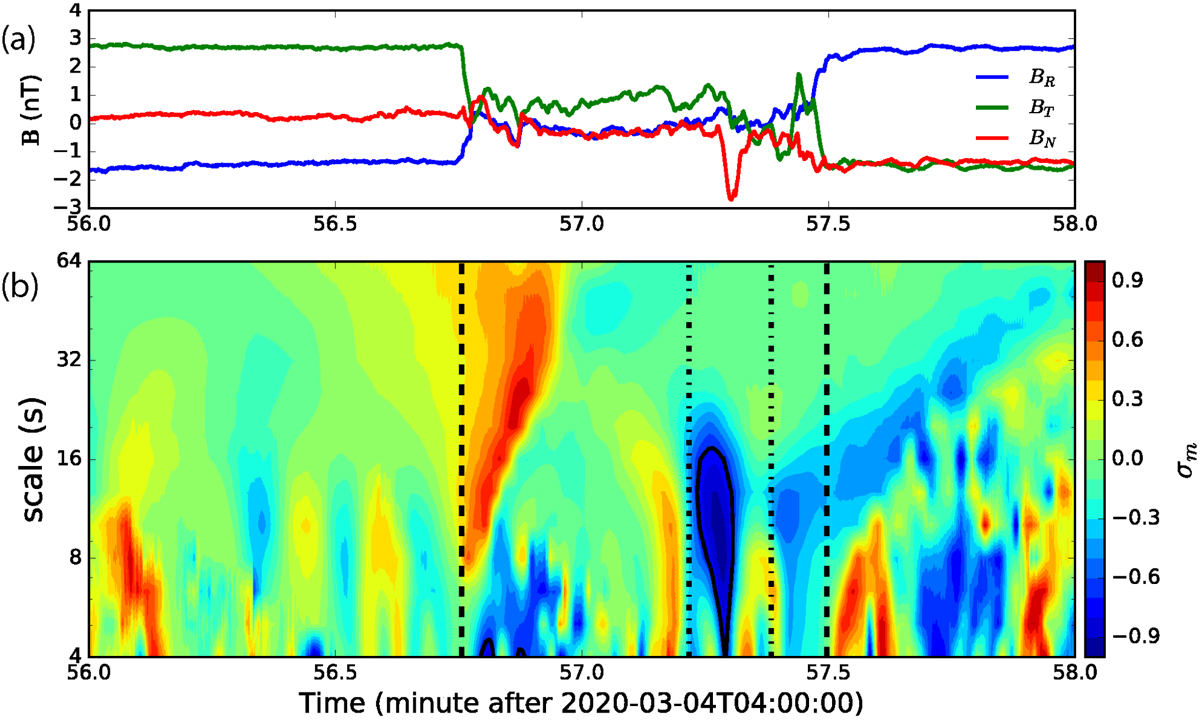
Normalised magnetic helicity analysis of the Solar Orbiter data. (a) Magnetic field observations. (b) Spectrogram of the reduced normalised magnetic helicity σm. The contour line in panel b is drawn at levels of |σm| = 0.7. The vertical dashed vertical lines represents the current sheet interval, and the vertical dashed-dotted lines the flux rope interval.
Current usage metrics show cumulative count of Article Views (full-text article views including HTML views, PDF and ePub downloads, according to the available data) and Abstracts Views on Vision4Press platform.
Data correspond to usage on the plateform after 2015. The current usage metrics is available 48-96 hours after online publication and is updated daily on week days.
Initial download of the metrics may take a while.