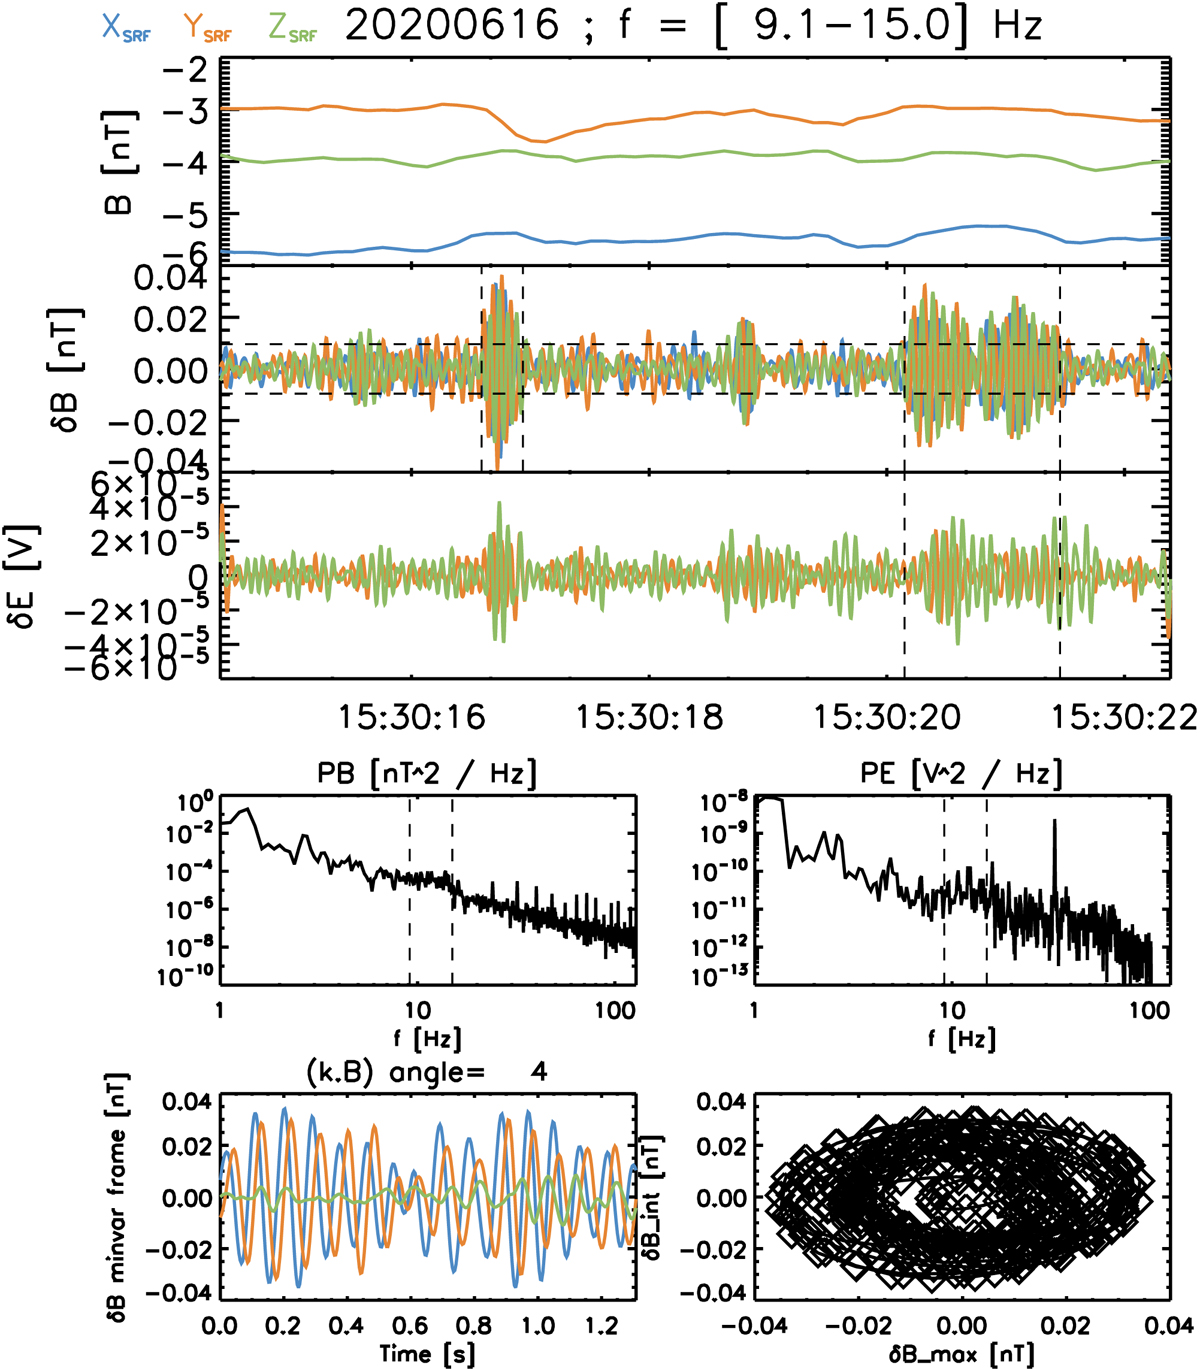
Fig. 1.
Download original image
Example of RPW/LFR snapshot at 256 Hz and wave packet detection. Three first rows show the background magnetic field, and the AC magnetic (X, Y, and Z components), and electric field (Y and Z components). Horizontal dashed lines shows three times the noise level and vertical dashed lines indicate the detected wave packets. Fourth row shows the magnetic and electric power spectra. Fifth row show the minimum variance analysis and hodogram for the longest wavepacket, indicated in the AC electric field panel (third row).
Current usage metrics show cumulative count of Article Views (full-text article views including HTML views, PDF and ePub downloads, according to the available data) and Abstracts Views on Vision4Press platform.
Data correspond to usage on the plateform after 2015. The current usage metrics is available 48-96 hours after online publication and is updated daily on week days.
Initial download of the metrics may take a while.