Free Access
Fig. 10.
Download original image
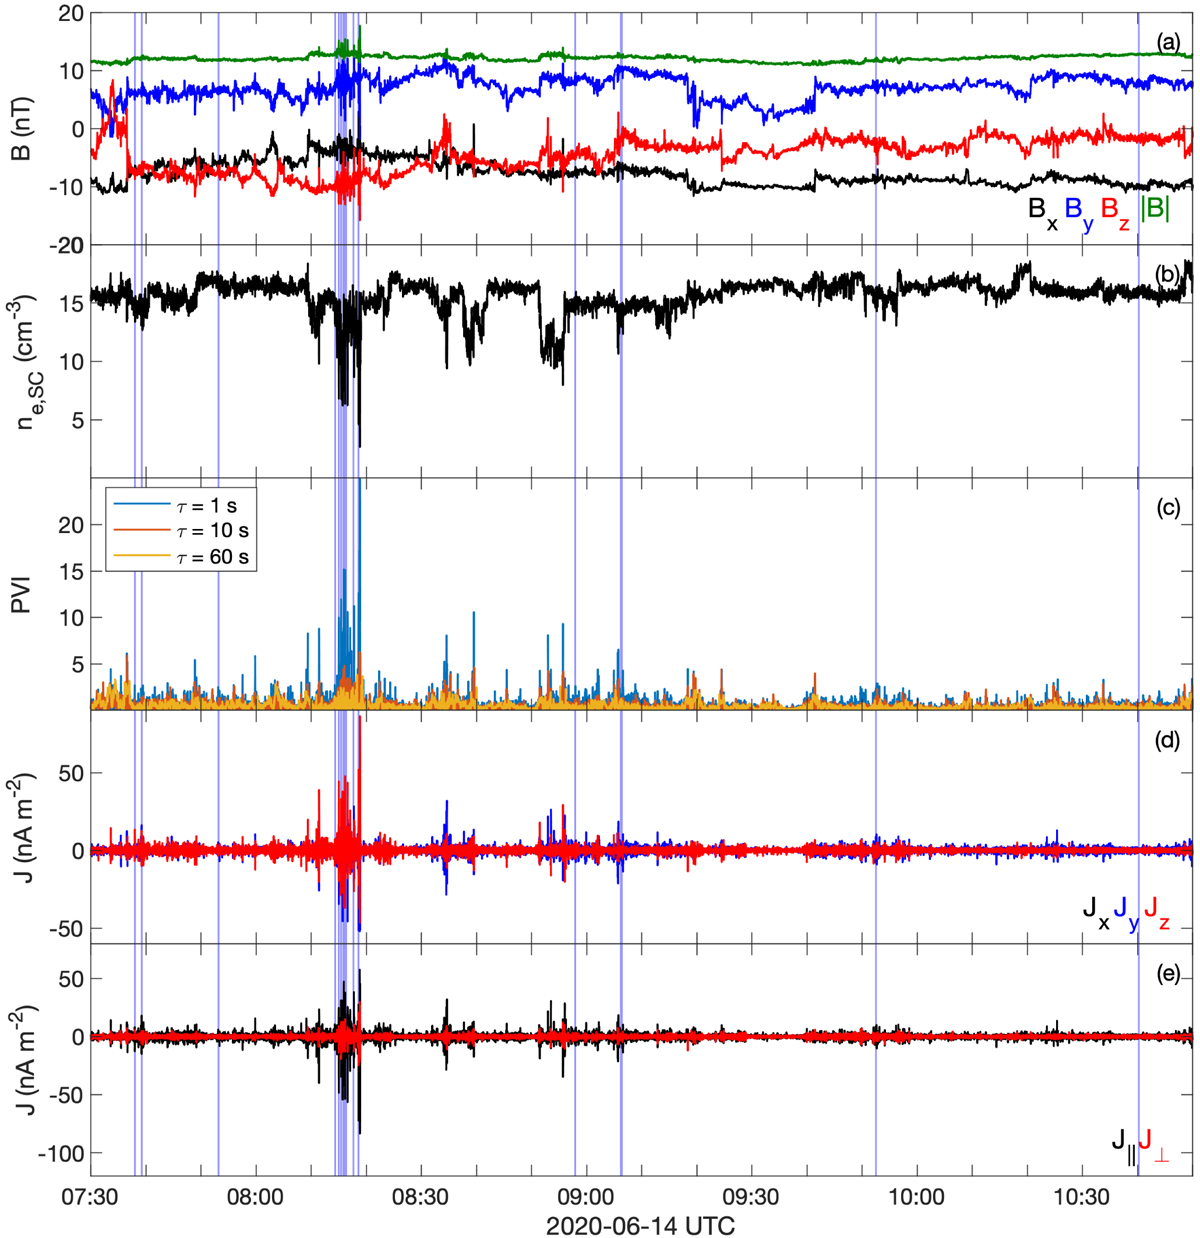
A solar wind interval by Solar Orbiter on 2020 June 14. (a) B. (b) ne, SC. (c) PVI values for τ = 1 s (blue), 10 s (red), and 60 s (gold). (d) and (e) J in SRF and field-aligned coordinates, respectively. The blue-shaded regions indicate times when ion-acoustic wave snapshots are observed by TDS.
Current usage metrics show cumulative count of Article Views (full-text article views including HTML views, PDF and ePub downloads, according to the available data) and Abstracts Views on Vision4Press platform.
Data correspond to usage on the plateform after 2015. The current usage metrics is available 48-96 hours after online publication and is updated daily on week days.
Initial download of the metrics may take a while.