Fig. 8.
Download original image
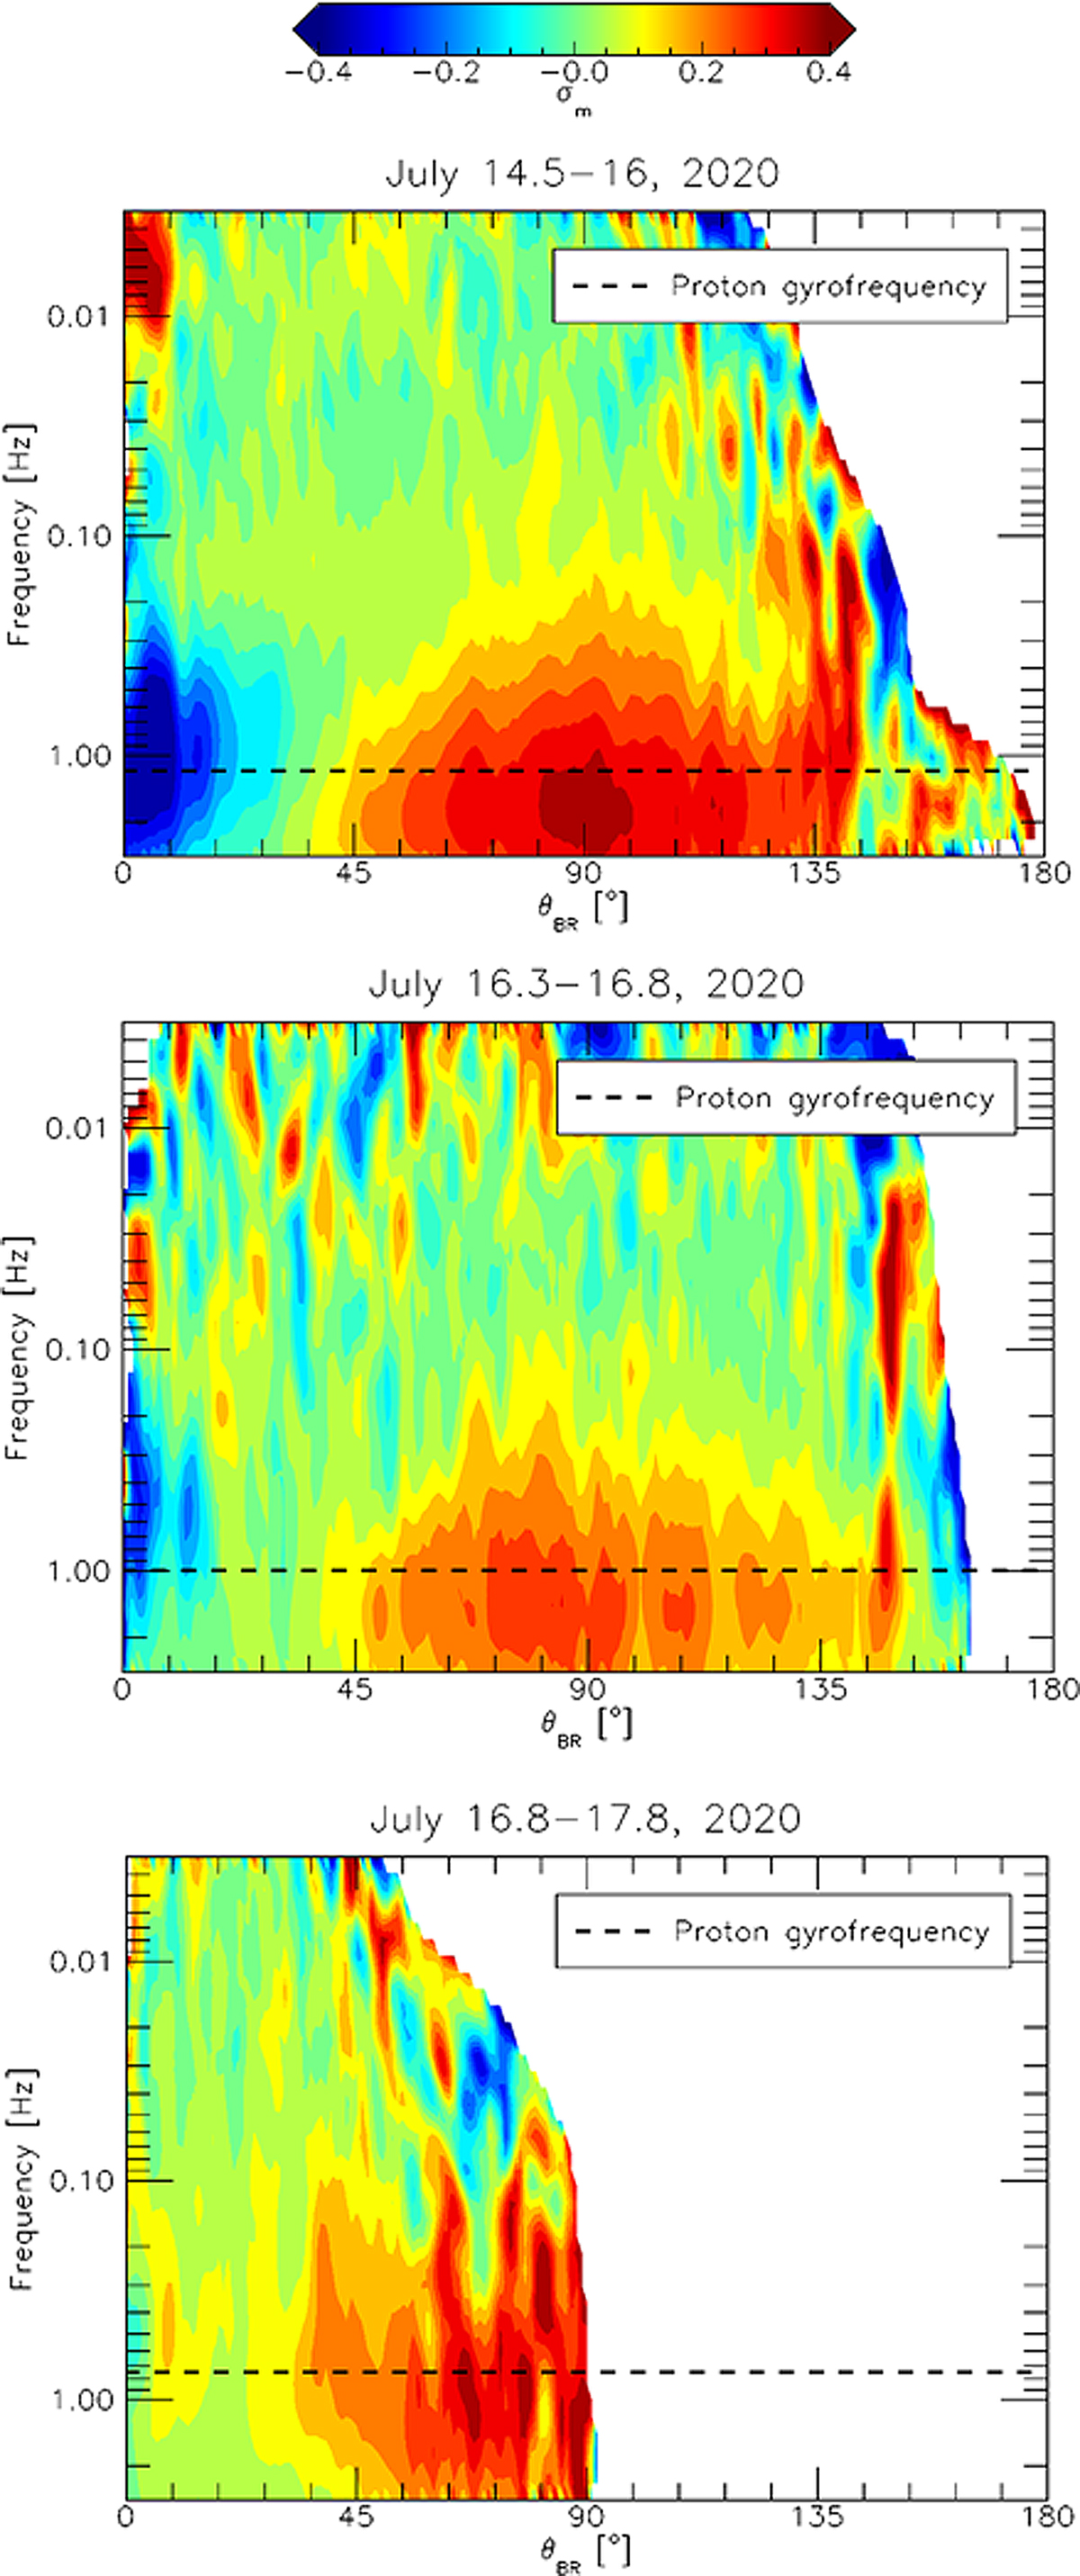
Scalogram of the normalised magnetic helicity, σm (color map), with respect to the angle, θBR, between the magnetic field and the radial direction. From top to bottom: main portion of the stream, intermediate region and rarefaction region. The dashed line in each plot corresponds to the proton gyrofrequency in the S/C frame.
Current usage metrics show cumulative count of Article Views (full-text article views including HTML views, PDF and ePub downloads, according to the available data) and Abstracts Views on Vision4Press platform.
Data correspond to usage on the plateform after 2015. The current usage metrics is available 48-96 hours after online publication and is updated daily on week days.
Initial download of the metrics may take a while.