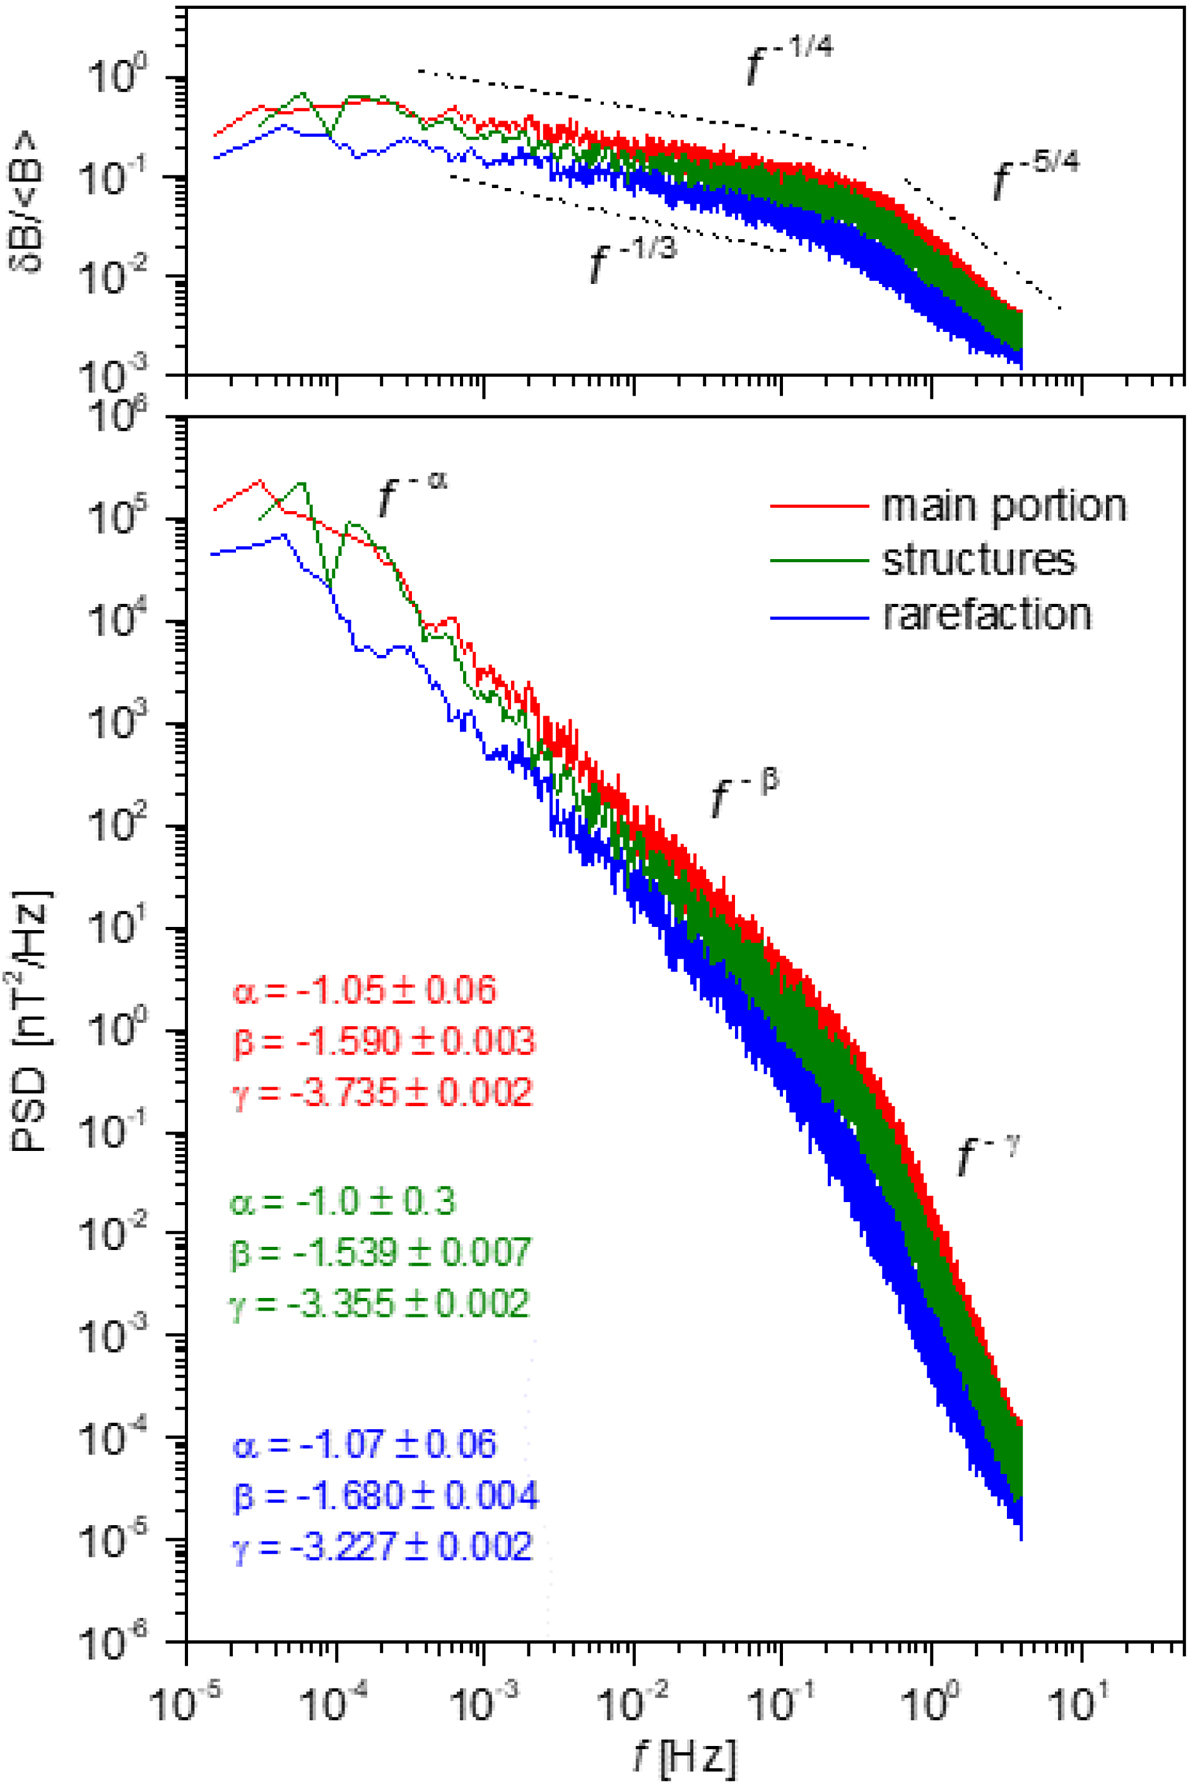
Fig. 6.
Download original image
Spectral analysis. Top panel: normalised power spectral density (PSD), δB/⟨B⟩, derived as explained in the text, for the main portion of the stream (red), for the rarefaction region (blue), and for the intermediate region (green). The dashed lines correspond to the Kolmogorov scaling (δB(f)∼f−1/3) and to the Kraichnan scaling (δB(f)∼f−1/4), along with a scaling δB(f)∼f−5/4 corresponding to P(f)∼f−7/2, according to the normalisation described in the text. Bottom panel: PSD of the trace of magnetic field components for the three identified regions as in the top panel. The slopes of the three frequency regimes are indicated with the same color code of the different portions of the stream and are computed over the following frequency ranges: f < 3 × 10⁻⁴ Hz, 2 × 10⁻³ < f < 10−1 Hz and 2 × 10⁻¹ < f < 2 Hz.
Current usage metrics show cumulative count of Article Views (full-text article views including HTML views, PDF and ePub downloads, according to the available data) and Abstracts Views on Vision4Press platform.
Data correspond to usage on the plateform after 2015. The current usage metrics is available 48-96 hours after online publication and is updated daily on week days.
Initial download of the metrics may take a while.