Fig. 5.
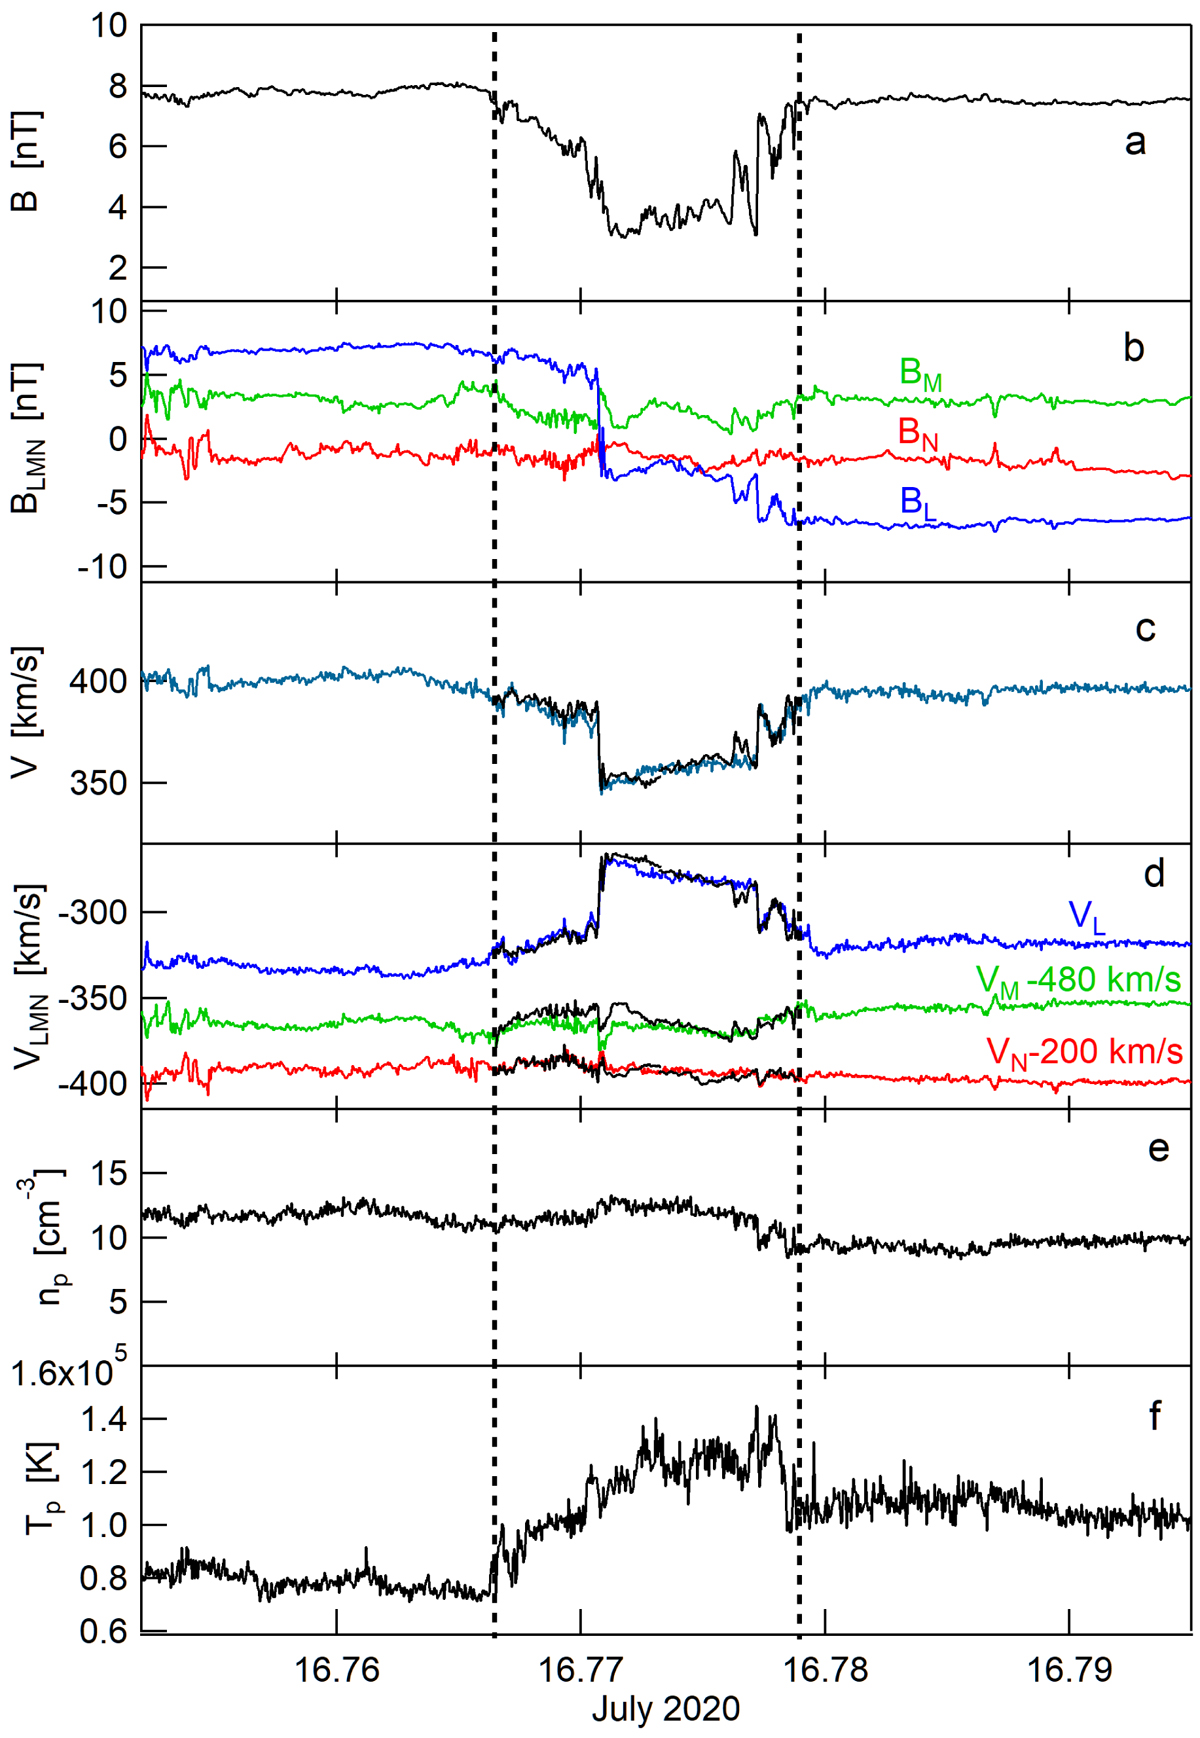
Download original image
Characterisation of the reconnection exhaust event. From top to bottom: the magnetic field magnitude, B (panel a); the magnetic field components in the LMN coordinates system (panel b); the solar wind speed, Vsw (panel c); the solar wind velocity components in the LMN coordinates system (panel d); the proton number density, np (panel e); and the proton temperature, Tp (panel d). In panels c and d, the black lines represent the reconnection model predictions according to Eq. (3). The left (right) dashed line indicates the reference point used for the prediction in the leading (trailing) portion of the exhaust.
Current usage metrics show cumulative count of Article Views (full-text article views including HTML views, PDF and ePub downloads, according to the available data) and Abstracts Views on Vision4Press platform.
Data correspond to usage on the plateform after 2015. The current usage metrics is available 48-96 hours after online publication and is updated daily on week days.
Initial download of the metrics may take a while.