Fig. 8.
Download original image
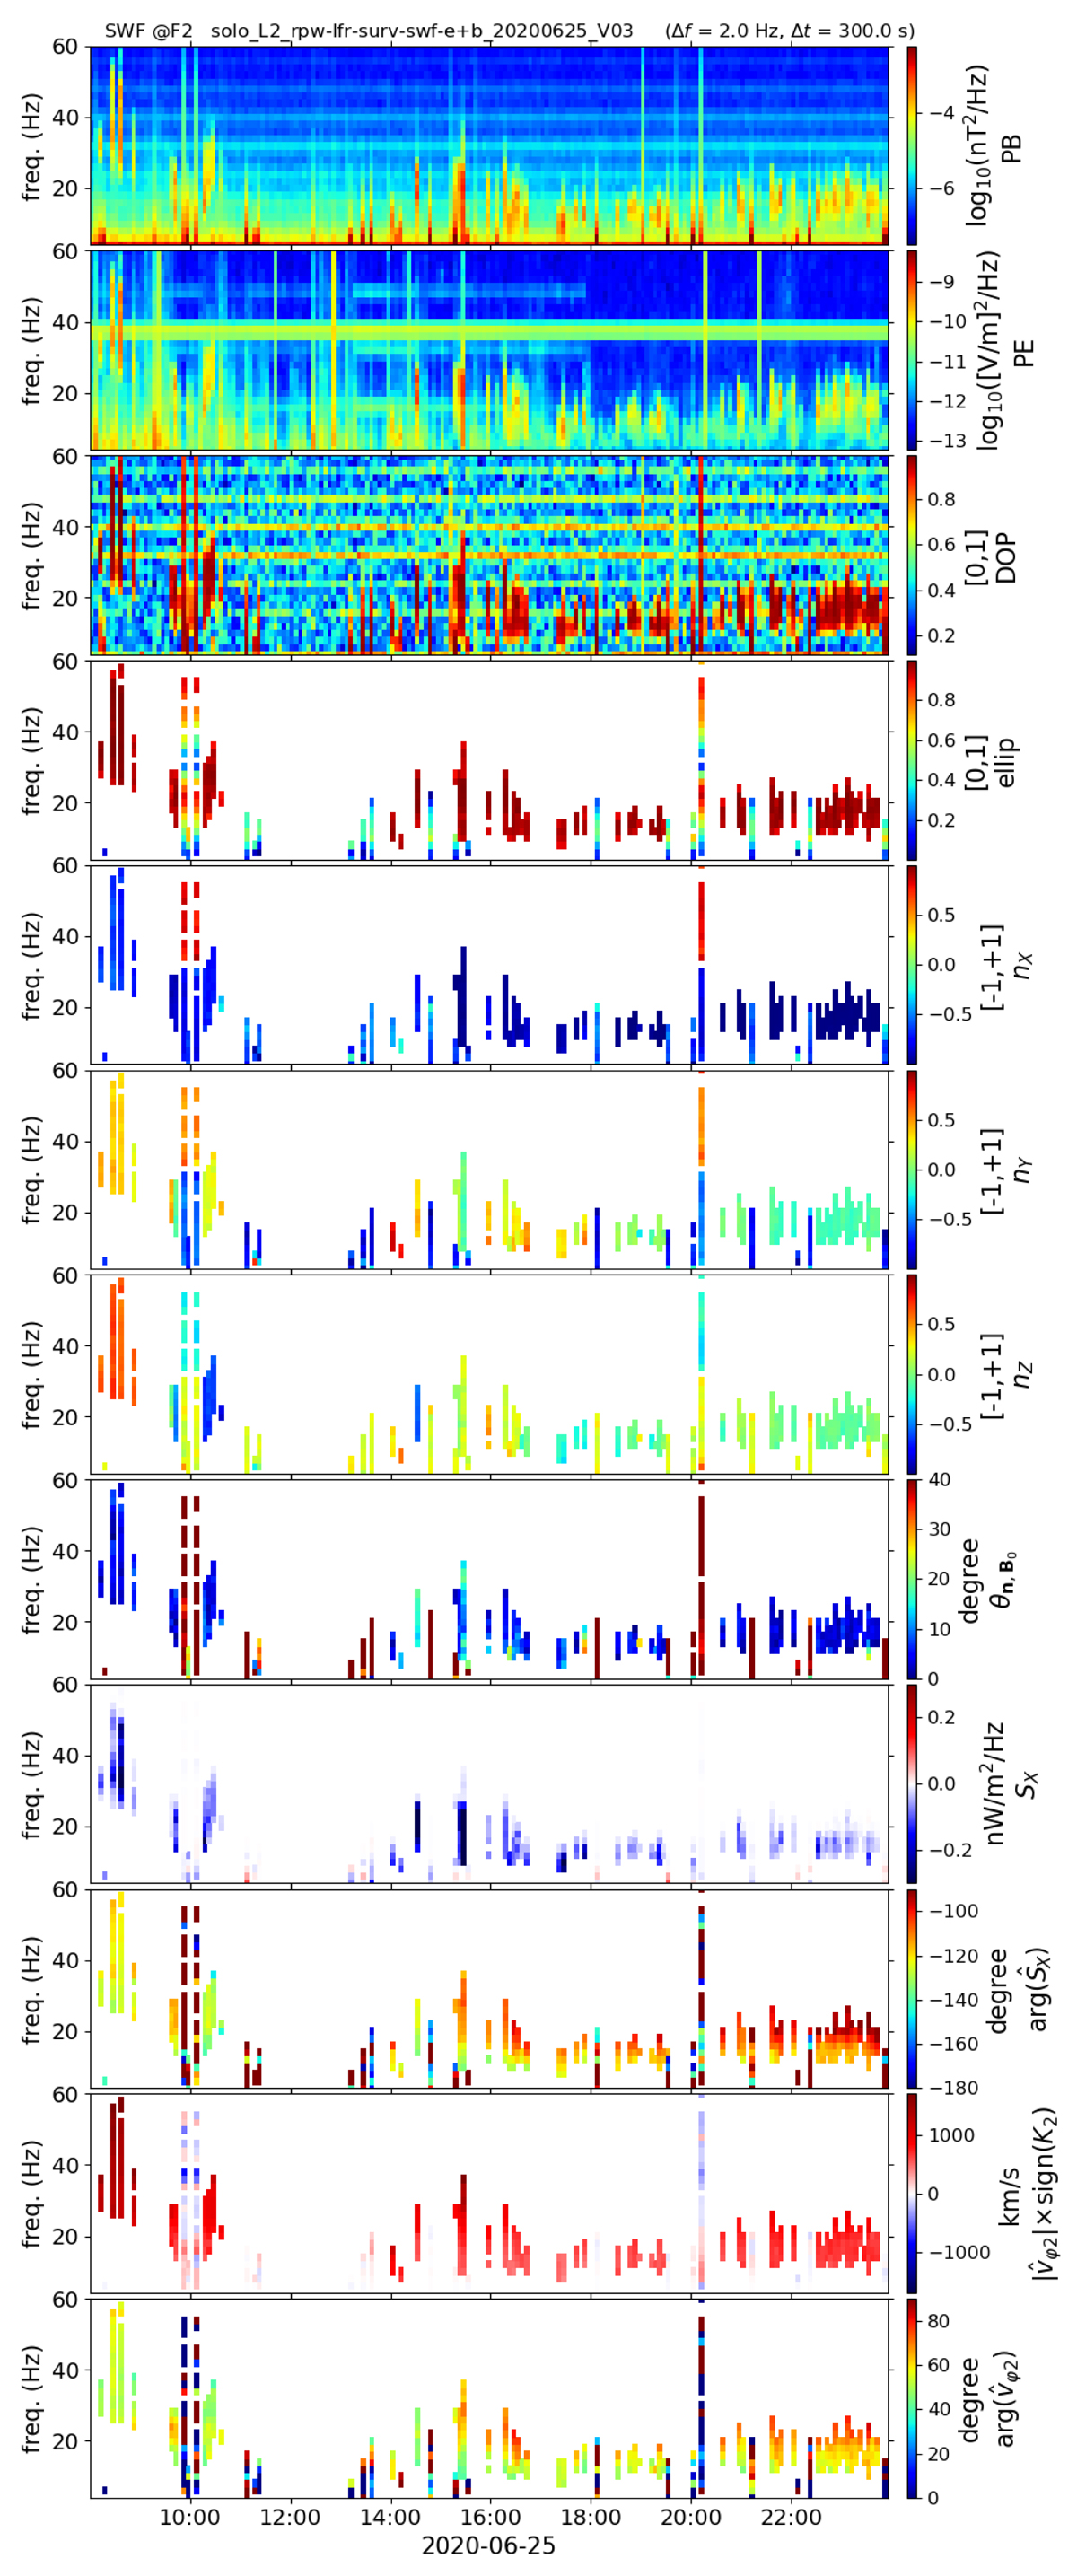
Case study of June 25, 2020: Spectrograms of the wave parameters calculated on the ground from the snapshots of waveform, for the same time interval and frequency range as in Fig. 6, and with the same format as in Fig. 3, except for the last two panels where the second method of phase velocity measurement (as given by Eq. (16)) is used instead of the first one, as given by Eq. (13). Again, only cases matching DOP ≥ 0.9 are displayed. The strong spurious vertical lines already observed in the magnetic power spectrograms of Fig. 6 are still visible here in the top panel (PB), as well as in all others, as spurious coherent vertical lines.
Current usage metrics show cumulative count of Article Views (full-text article views including HTML views, PDF and ePub downloads, according to the available data) and Abstracts Views on Vision4Press platform.
Data correspond to usage on the plateform after 2015. The current usage metrics is available 48-96 hours after online publication and is updated daily on week days.
Initial download of the metrics may take a while.