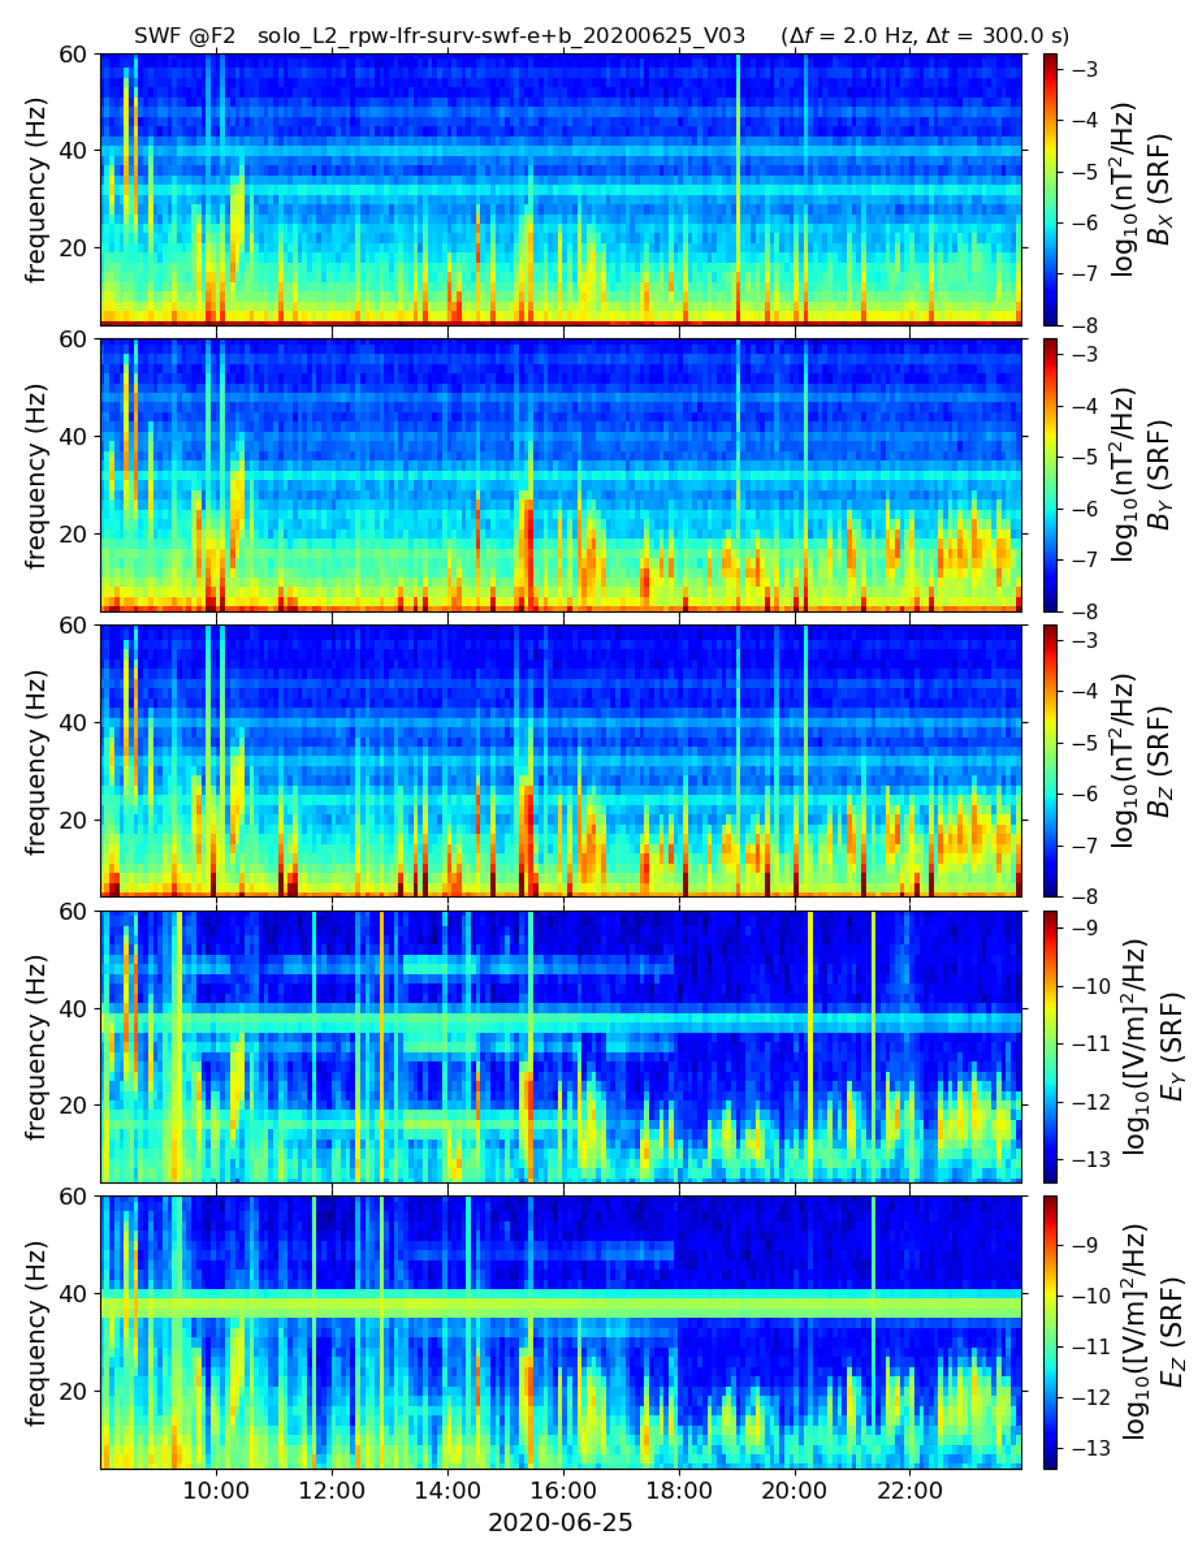
Fig. 6.
Download original image
Case study of June 25, 2020: Spectrograms of the electric and magnetic PSD computed on the ground from the snapshots of waveform. The line visible at 38 Hz on the electric field components is a spurious interference line. The weaker horizontal lines visible in the background of the magnetic field components are also stray lines, the same as we have already seen in Fig. 1. Strong parasitic vertical lines are also observed on the magnetic field components: they are caused by the activation of the SCM survival heater.
Current usage metrics show cumulative count of Article Views (full-text article views including HTML views, PDF and ePub downloads, according to the available data) and Abstracts Views on Vision4Press platform.
Data correspond to usage on the plateform after 2015. The current usage metrics is available 48-96 hours after online publication and is updated daily on week days.
Initial download of the metrics may take a while.