Fig. 5.
Download original image
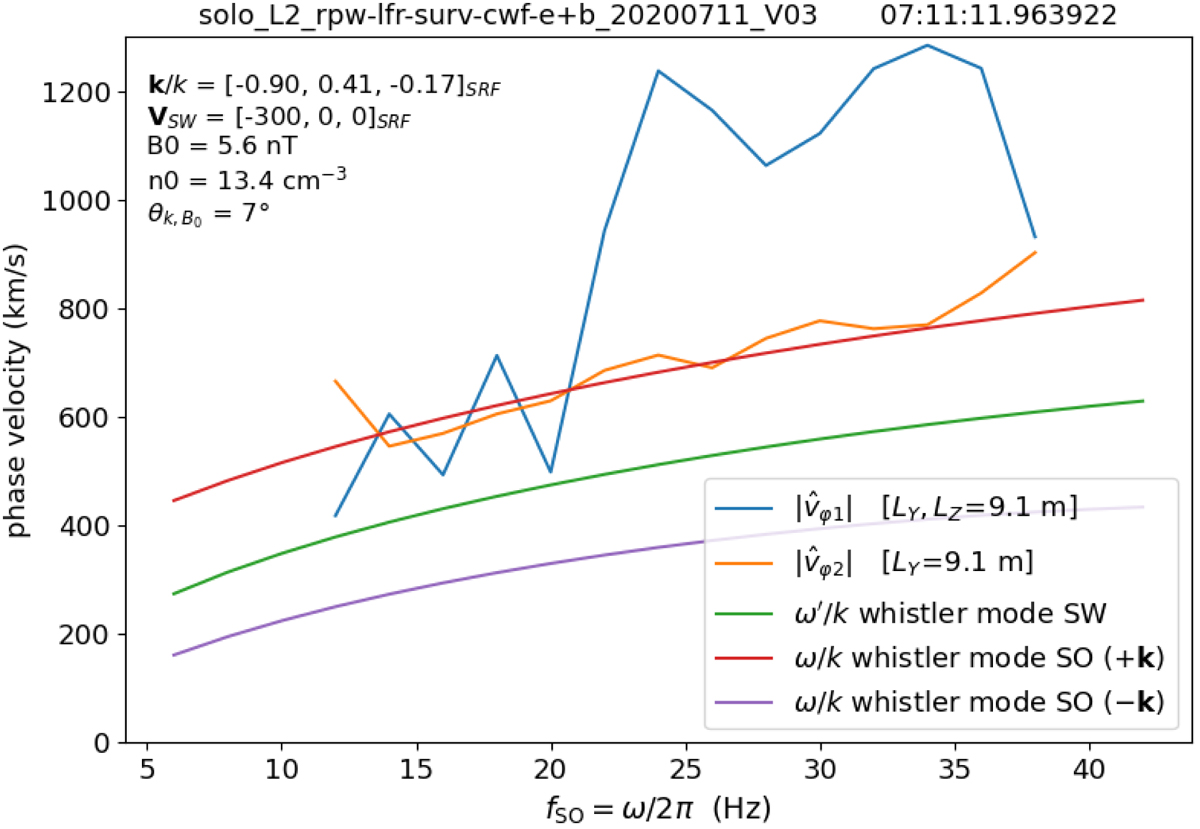
Case study of July 11, 2020: Phase velocity spectra corresponding to 07:11:12 UTC, and comparison with theoretical models. Blue and orange curves: observed phase velocity spectra with DOP > 0.75, as already shown in Fig. 4, and still with LY = LZ = 9.1 m. Green curve: cold plasma model of the phase velocity of the whistler mode, calculated in the plasma frame, i.e., in the solar wind (SW) frame, at frequencies observed in the Solar Orbiter (SO) frame. Purple and red curves: same calculation as for the green curve but performed in the SO frame, thus taking into account the Doppler frequency shift, for the two directions of wave propagation, −k and +k, respectively. See text for more details.
Current usage metrics show cumulative count of Article Views (full-text article views including HTML views, PDF and ePub downloads, according to the available data) and Abstracts Views on Vision4Press platform.
Data correspond to usage on the plateform after 2015. The current usage metrics is available 48-96 hours after online publication and is updated daily on week days.
Initial download of the metrics may take a while.