Fig. 4.
Download original image
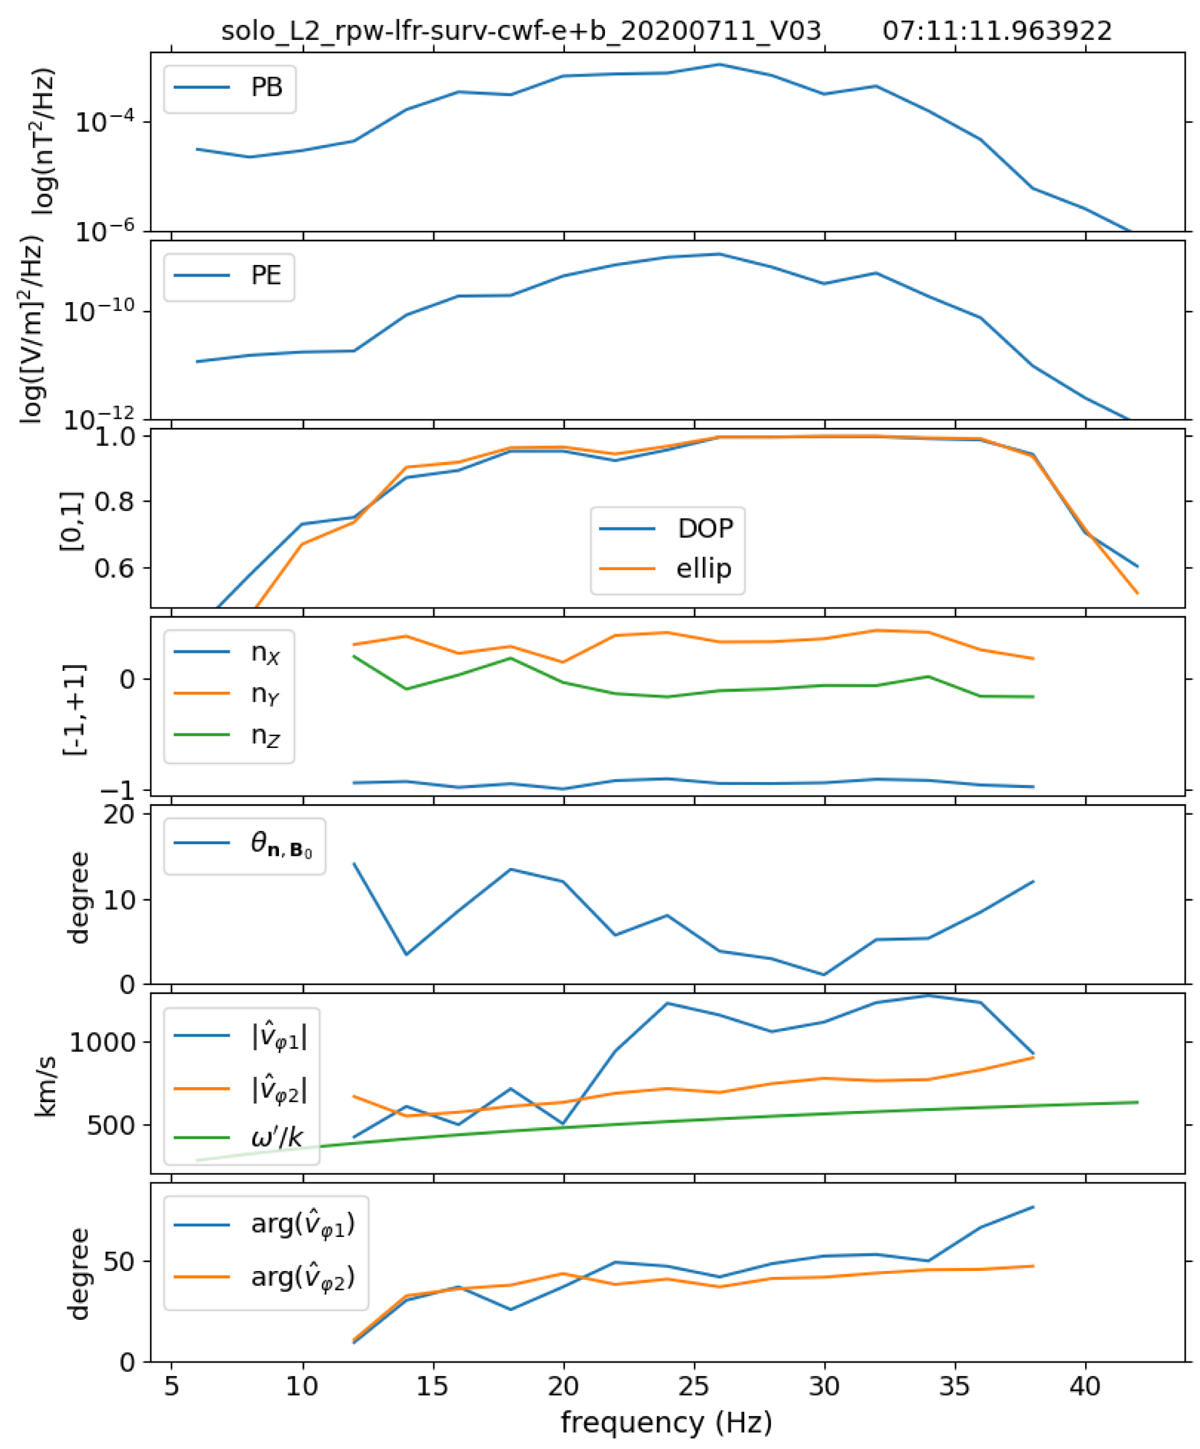
Case study of July 11, 2020: Spectra extracted from the spectrograms displayed in Fig. 3 and corresponding to 07:11:12 UTC, plus a second estimate of the phase velocity and a comparison with a theoretical whistler mode phase velocity model. From top to bottom: magnetic (PB) and electric (PE) trace power spectra of the measured field fluctuations; degree of polarization (DOP) and wave ellipticity (ellip); wave normal vector components (nX, nY, nZ) in SRF; angle between n and B0; observed phase velocities ![]() and
and ![]() , and cold plasma model of the whistler mode phase velocity calculated in the plasma frame (ω′/k); arguments of
, and cold plasma model of the whistler mode phase velocity calculated in the plasma frame (ω′/k); arguments of ![]() and
and ![]() . See text for more details.
. See text for more details.
Current usage metrics show cumulative count of Article Views (full-text article views including HTML views, PDF and ePub downloads, according to the available data) and Abstracts Views on Vision4Press platform.
Data correspond to usage on the plateform after 2015. The current usage metrics is available 48-96 hours after online publication and is updated daily on week days.
Initial download of the metrics may take a while.