Open Access
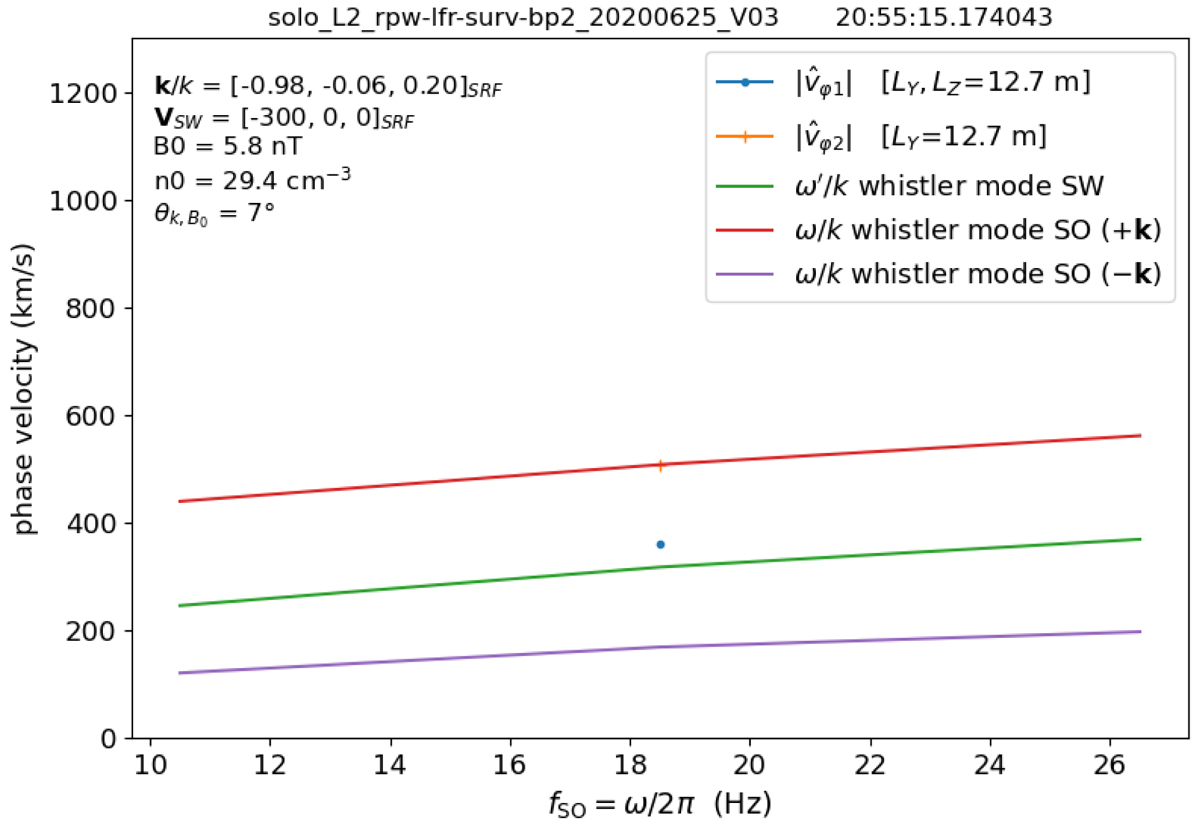
Fig. 16.
Download original image
Case study of June 25, 2020: Same comparison between the model and observation as in Fig. 15, but for the BP2 spectra measured at 20:55:15.2 UTC, and with LY = LZ = 12.7 m.
Current usage metrics show cumulative count of Article Views (full-text article views including HTML views, PDF and ePub downloads, according to the available data) and Abstracts Views on Vision4Press platform.
Data correspond to usage on the plateform after 2015. The current usage metrics is available 48-96 hours after online publication and is updated daily on week days.
Initial download of the metrics may take a while.