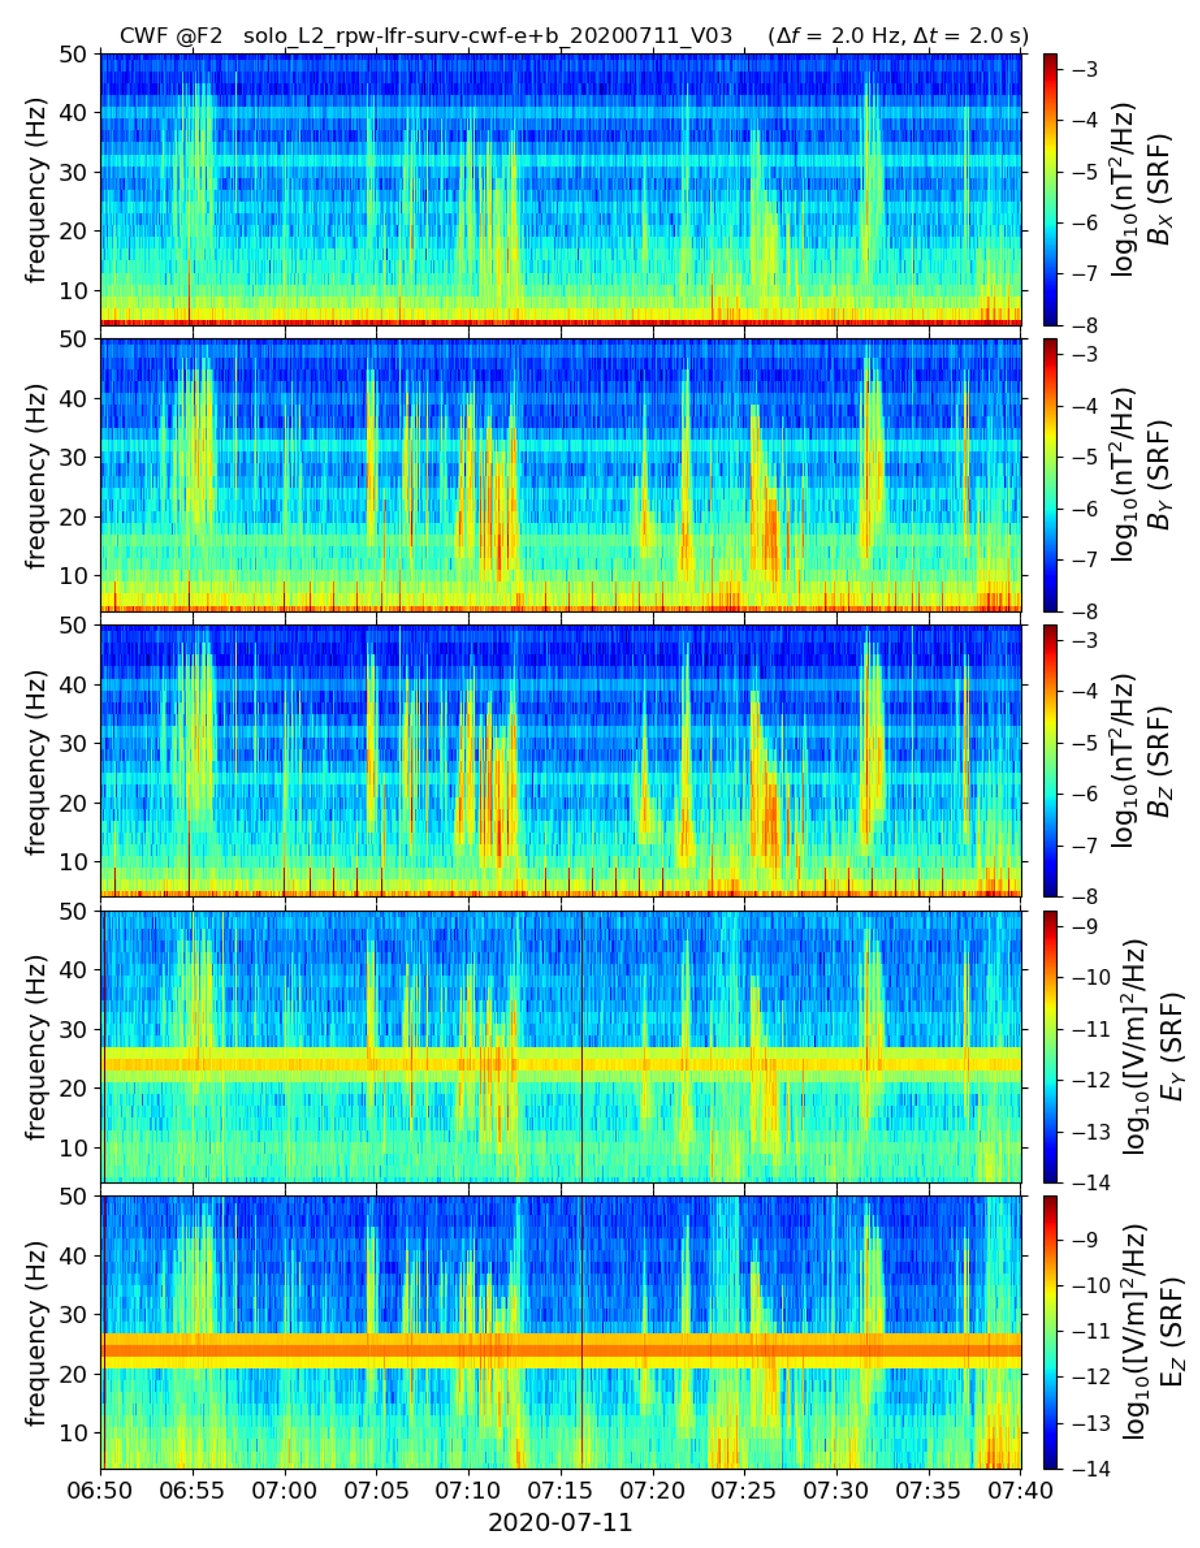
Fig. 1.
Download original image
Case study of July 11, 2020: Spectrograms of the electric and magnetic PSD computed on the ground from the continuous waveforms. The line visible at 24 Hz on the electric field components is a spurious interference line. Although weaker, other stray horizontal lines are also visible in the background of the magnetic field components. They are produced at 8 Hz and its harmonics, and originate from the spacecraft (AOCS Synchronization Pulse).
Current usage metrics show cumulative count of Article Views (full-text article views including HTML views, PDF and ePub downloads, according to the available data) and Abstracts Views on Vision4Press platform.
Data correspond to usage on the plateform after 2015. The current usage metrics is available 48-96 hours after online publication and is updated daily on week days.
Initial download of the metrics may take a while.