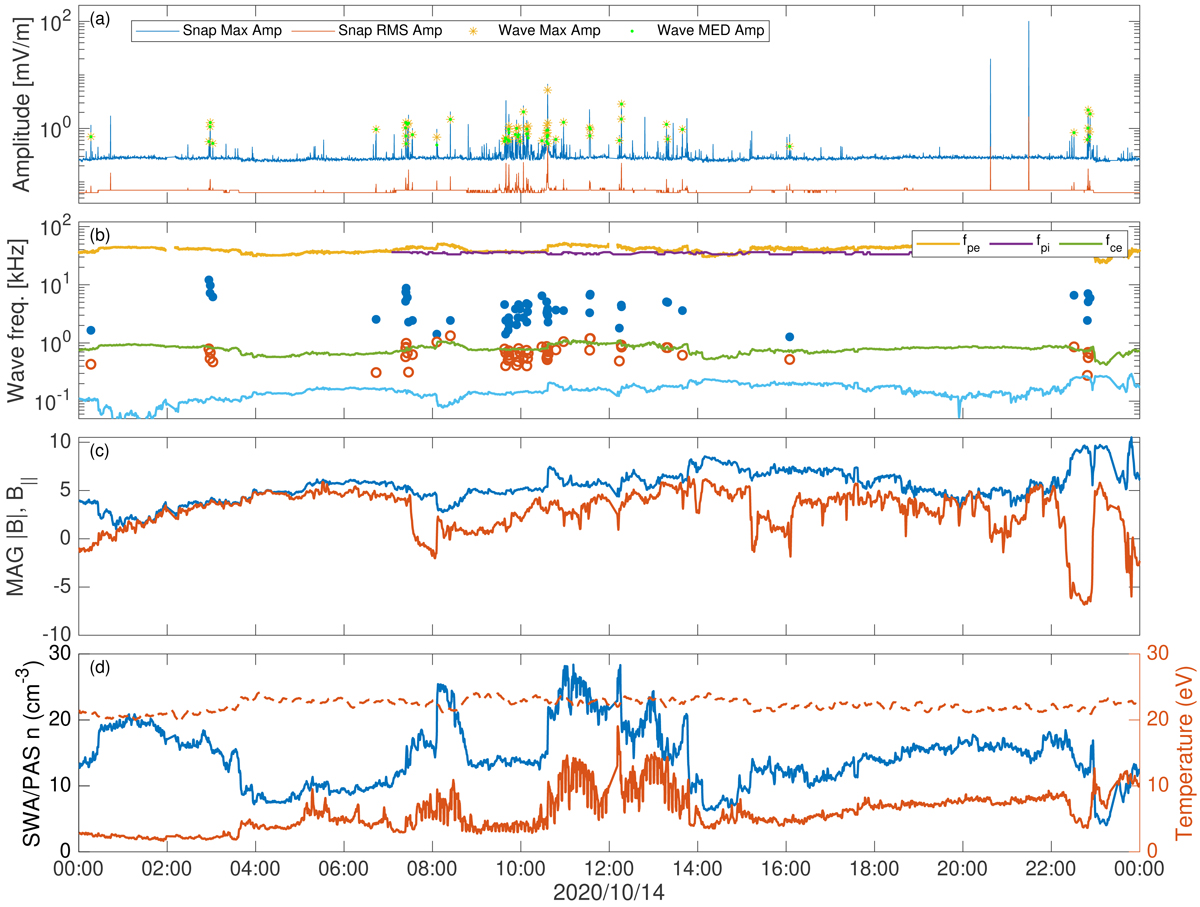
Fig. 7.
Download original image
One day of fields and particle observations on Oct. 14, 2020: (a) Statistics of RPW/TDS snapshots and wave amplitudes are plotted on the top panel; (b) Distribution of frequencies for detected waves in spacecraft (blue circles) and plasma rest (orange circles) frames. Electron (orange line) and proton (yellow line) plasma frequency estimated from the measurements of RPW/BIAS and SWA/PAS instruments, respectively; (c) Magnitude (blue) and parallel component with respect to the solar wind direction (orange) of the ambient magnetic field from the MAG instrument; (d) Proton density (blue line), proton temperature (orange solid line), and electron temperature (orange dashed line) estimated from the SWA/PAS and SWA/EAS data.
Current usage metrics show cumulative count of Article Views (full-text article views including HTML views, PDF and ePub downloads, according to the available data) and Abstracts Views on Vision4Press platform.
Data correspond to usage on the plateform after 2015. The current usage metrics is available 48-96 hours after online publication and is updated daily on week days.
Initial download of the metrics may take a while.