Fig. 3.
Download original image
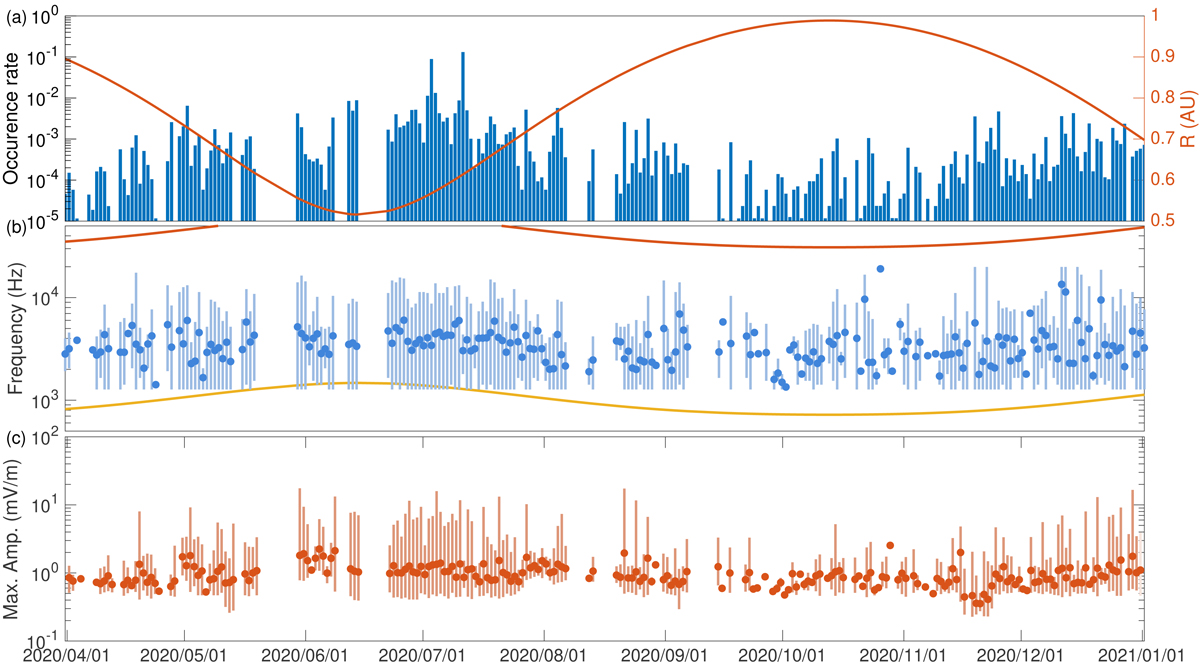
Statistics for the first year of wave detection by the RPW/TDS. Panel a: occurrence rate of intense waves below 20 kHz (blue bars) with overplotted distances from the Sun (orange line). A distribution of observed wave frequencies with their variation is shown in the panel b. Orange and yellow lines present modelled electron and proton plasma frequency, respectively. Averaged maxima of wave amplitudes with their variations are in the bottom panel c.
Current usage metrics show cumulative count of Article Views (full-text article views including HTML views, PDF and ePub downloads, according to the available data) and Abstracts Views on Vision4Press platform.
Data correspond to usage on the plateform after 2015. The current usage metrics is available 48-96 hours after online publication and is updated daily on week days.
Initial download of the metrics may take a while.