Fig. A.2.
Download original image
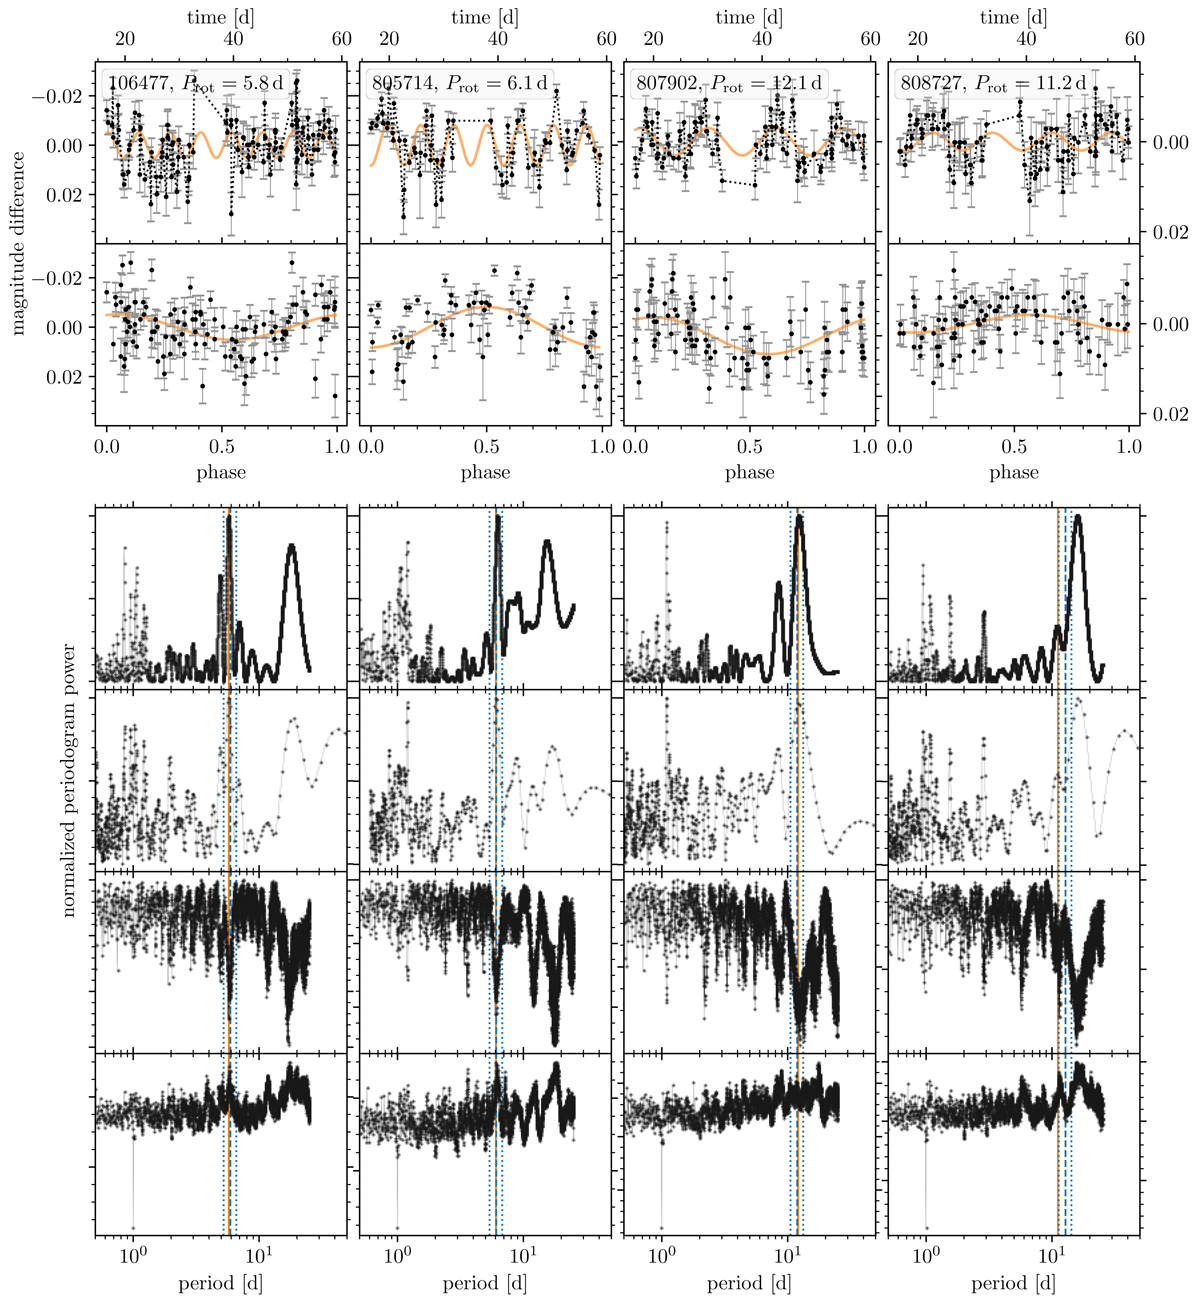
Four examples of light curves and their associated periodograms for (non-M) stars with newly identified, activity-informed rotation periods. Each column shows the data for one star. The two upper panels show the light curves in both the time and phase domains. We fit a sine with the rotation period and display it along with the data. The left scale is valid for the two leftmost plots, while the right scale is for the two light curves on the right. The lower panels show, from top to bottom, the Lomb-Scargle, CLEAN, phase-dispersion minimization, and Gregory-Loredo periodograms. In each periodogram, we mark both the rotation period (orange line) and the period estimated from the activity and its uncertainty (blue lines). Unlike the other periodograms, in the phase-dispersion minimization the best periods are represented by dips.
Current usage metrics show cumulative count of Article Views (full-text article views including HTML views, PDF and ePub downloads, according to the available data) and Abstracts Views on Vision4Press platform.
Data correspond to usage on the plateform after 2015. The current usage metrics is available 48-96 hours after online publication and is updated daily on week days.
Initial download of the metrics may take a while.