Free Access
Fig. 4.
Download original image
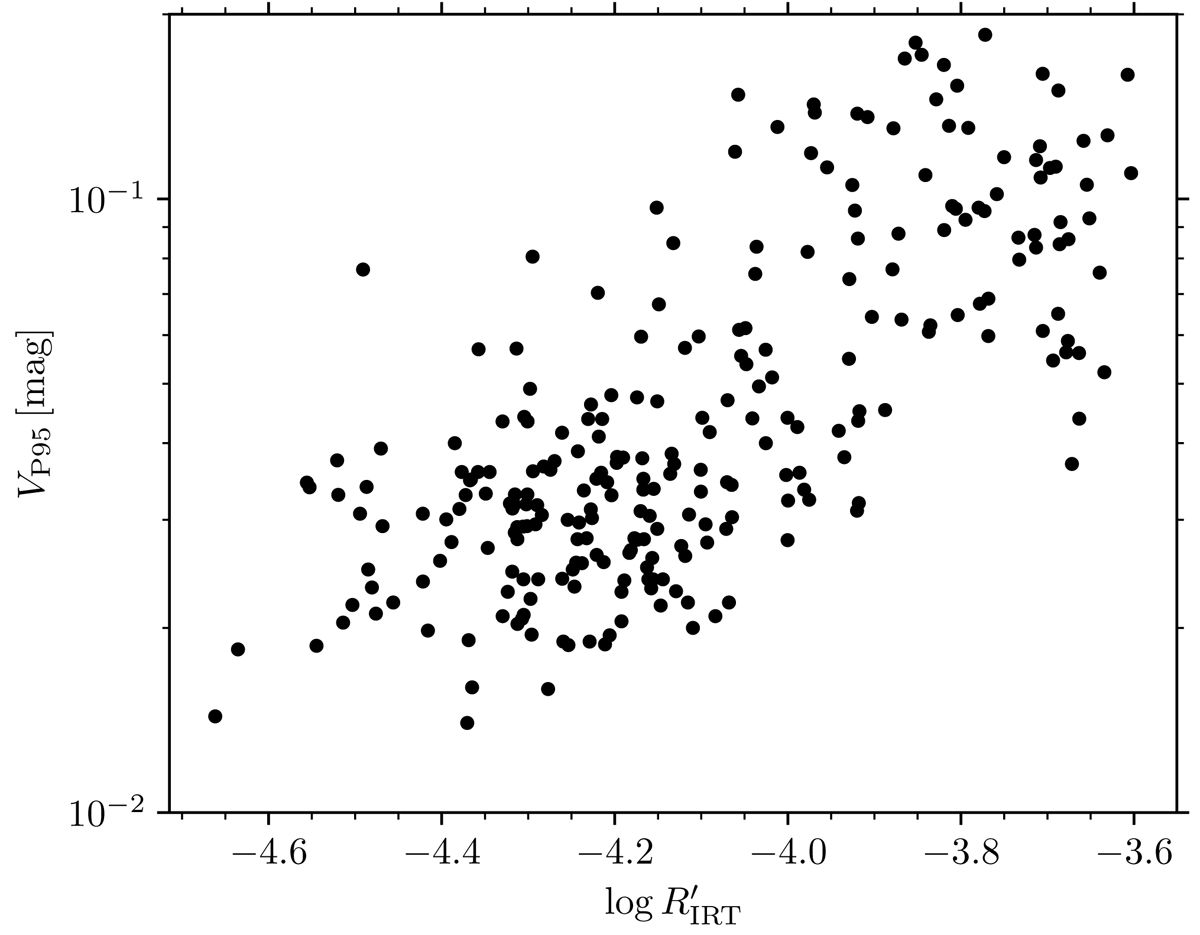
Photometric variability amplitude in the V band VP95 against chromospheric emission ratio log ![]() . The two activity indicators are correlated and represent two facets of the underlying magnetic activity.
. The two activity indicators are correlated and represent two facets of the underlying magnetic activity.
Current usage metrics show cumulative count of Article Views (full-text article views including HTML views, PDF and ePub downloads, according to the available data) and Abstracts Views on Vision4Press platform.
Data correspond to usage on the plateform after 2015. The current usage metrics is available 48-96 hours after online publication and is updated daily on week days.
Initial download of the metrics may take a while.