Fig. 2.
Download original image
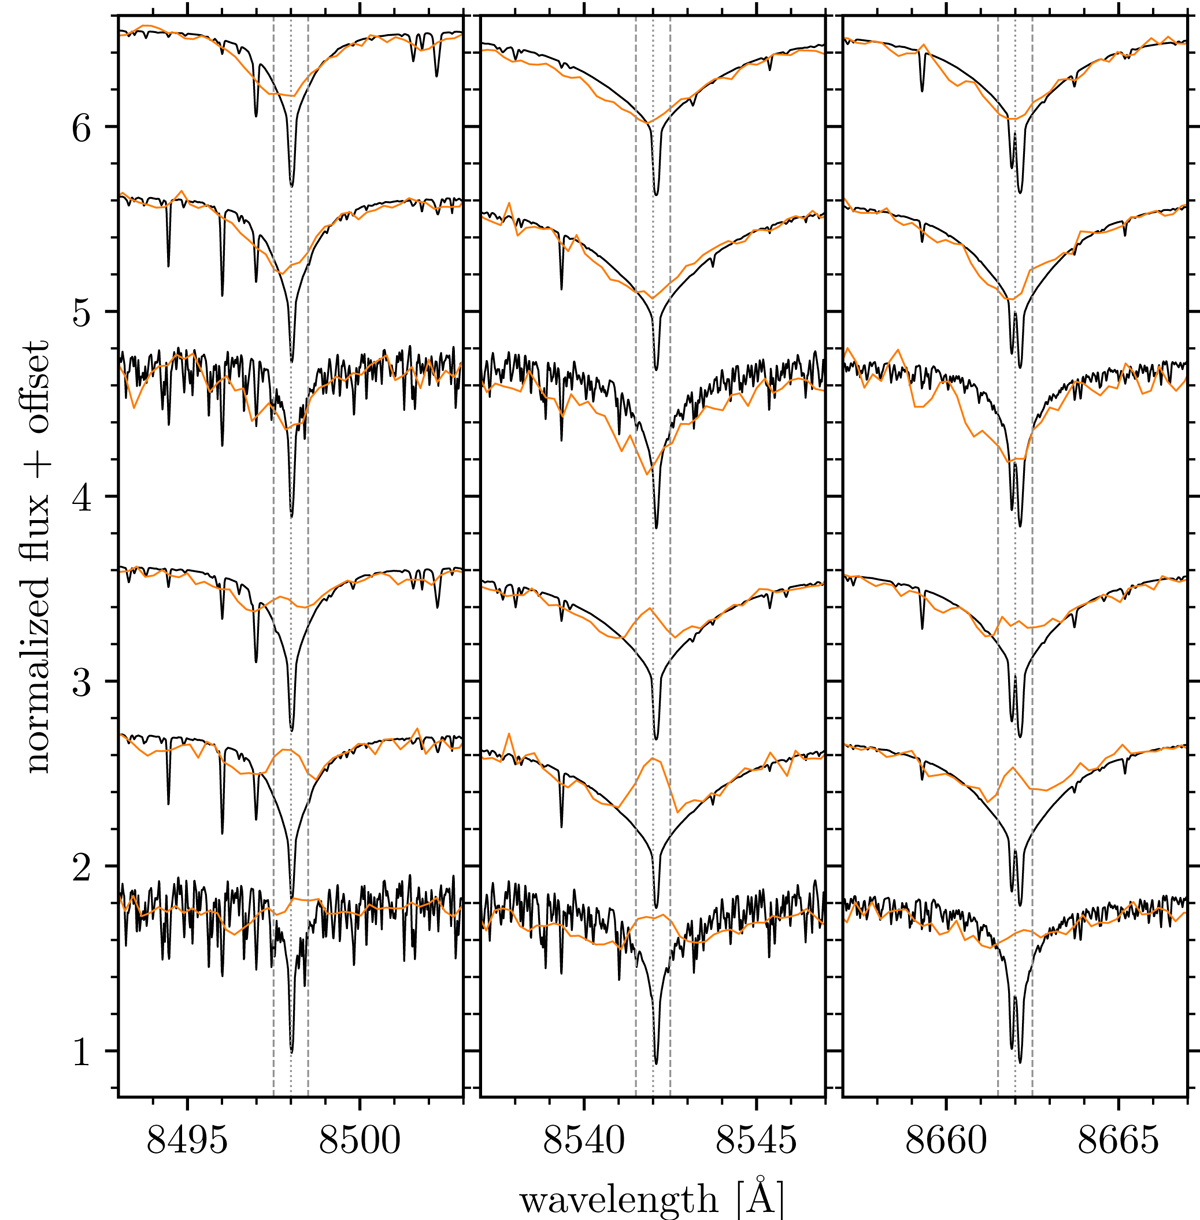
Spectral cutouts for example stars of different chromospheric activity (orange) and their corresponding PHOENIX spectra. Each panel is centred on one IRT line and shifted to the rest frame. The line centre is marked with a dotted line and the limits of the 1 Å wide integration window with dashed lines. The spectra are grouped into low-activity (top) and high-activity stars (bottom). The latter feature prominent fill-ins of the line cores. Earlier spectral types are higher. The topmost spectrum is from a G2 star, and the lowest is from an M 3 star. All six stars are marked with squares in the colour-activity diagram in Fig. 5a.
Current usage metrics show cumulative count of Article Views (full-text article views including HTML views, PDF and ePub downloads, according to the available data) and Abstracts Views on Vision4Press platform.
Data correspond to usage on the plateform after 2015. The current usage metrics is available 48-96 hours after online publication and is updated daily on week days.
Initial download of the metrics may take a while.