Fig. A.3.
Download original image
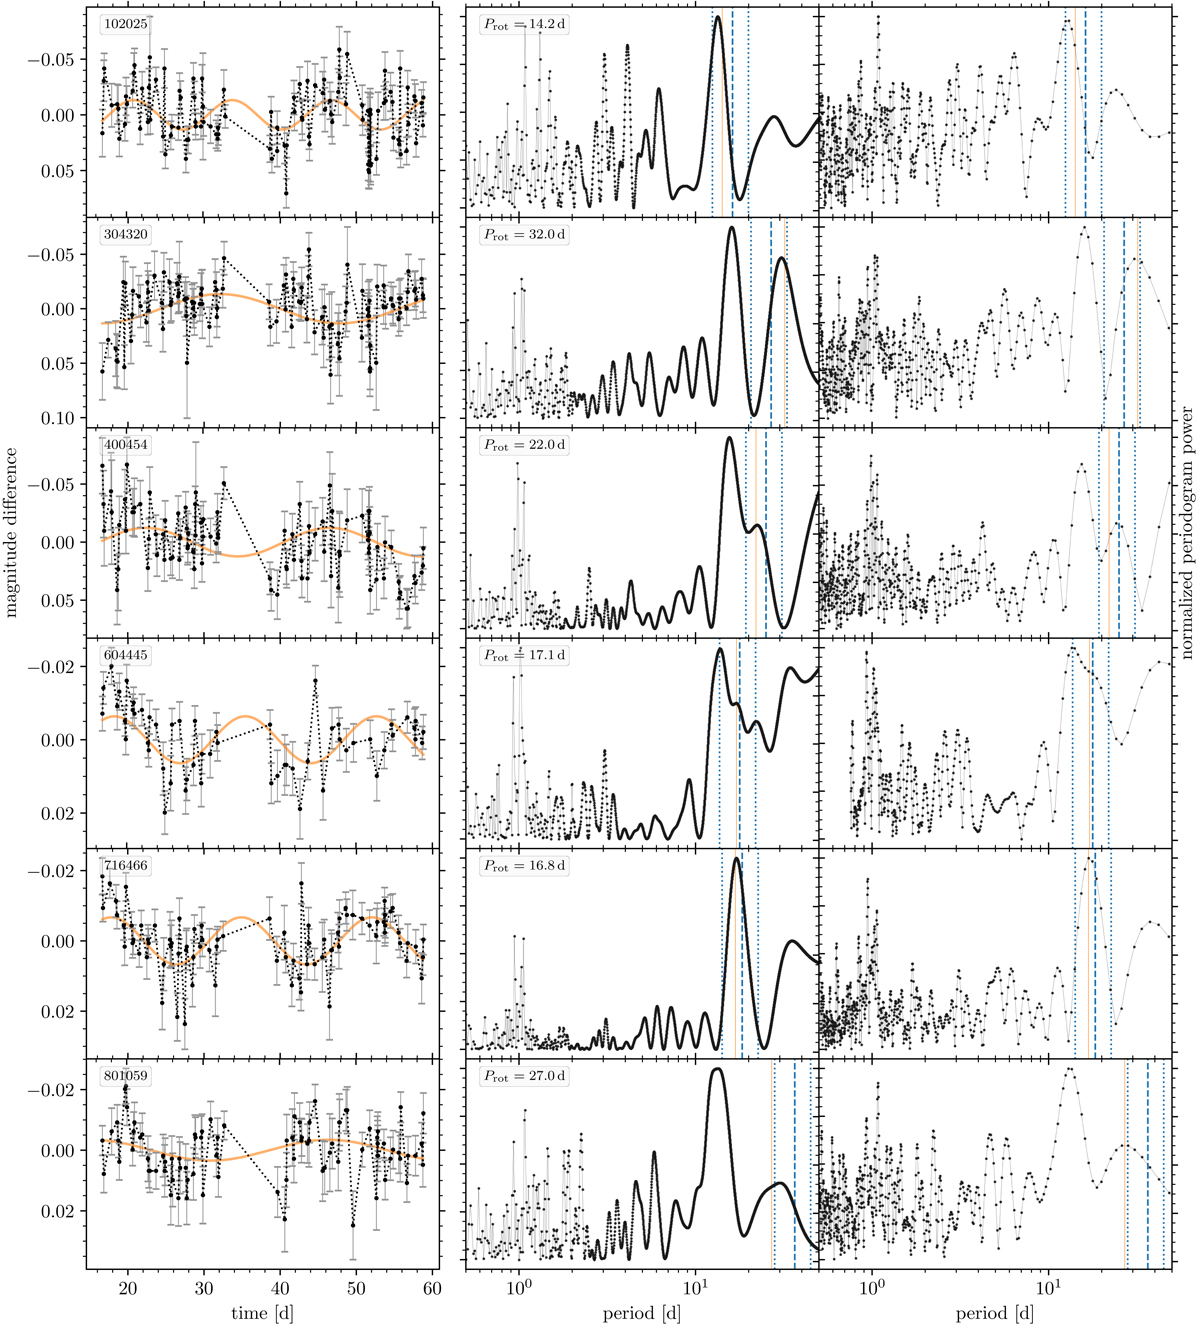
Left column: Light curves for the early M dwarfs of low stellar activity in NGC 3532 that have newly identified rotation periods. The orange line is a sine fit to the data with the newly identified likely rotation period. The first two light curves (from the top) are from V 120 s exposures, while all others are from Ic 600 s images. Centre column: Corresponding normalised generalized Lomb-Scargle diagram, with the selected rotation period marked by the orange vertical line. The dashed blue line indicates the rotation period estimated from the chromospheric activity measurement, and the dotted lines delineate the search range, which is derived from the period uncertainty. Right column: Same as the centre column but with the CLEAN periodogram. The offset between the peaks and the position of the best period for 102025 in the first row is due to the different peak positions in the phase-dispersion minimization and Gregory-Loredo periodograms (not displayed).
Current usage metrics show cumulative count of Article Views (full-text article views including HTML views, PDF and ePub downloads, according to the available data) and Abstracts Views on Vision4Press platform.
Data correspond to usage on the plateform after 2015. The current usage metrics is available 48-96 hours after online publication and is updated daily on week days.
Initial download of the metrics may take a while.