Fig. 2.
Download original image
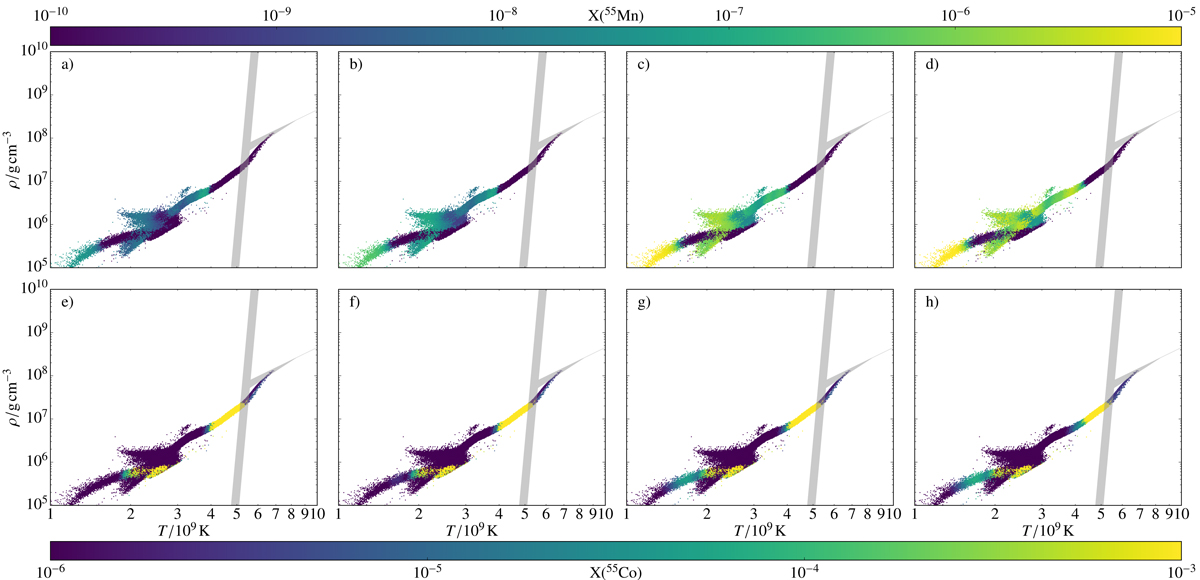
Tracer particle distribution in the Tpeak − ρpeak - plane for Models M10_03 at 0.01, 0.1, 1, and 3 Z⊙; the mass fractions of 55Mn (top, a–d) and 55Co (bottom, e–h) at t = 100 s are color-coded. The shaded areas split the domain into normal freeze-out from NSE, α-rich freeze-out, and incomplete Si-burning (clockwise starting at top right) following Woosley et al. (1973) (see also Lach et al. 2020).
Current usage metrics show cumulative count of Article Views (full-text article views including HTML views, PDF and ePub downloads, according to the available data) and Abstracts Views on Vision4Press platform.
Data correspond to usage on the plateform after 2015. The current usage metrics is available 48-96 hours after online publication and is updated daily on week days.
Initial download of the metrics may take a while.