Fig. 6.
Download original image
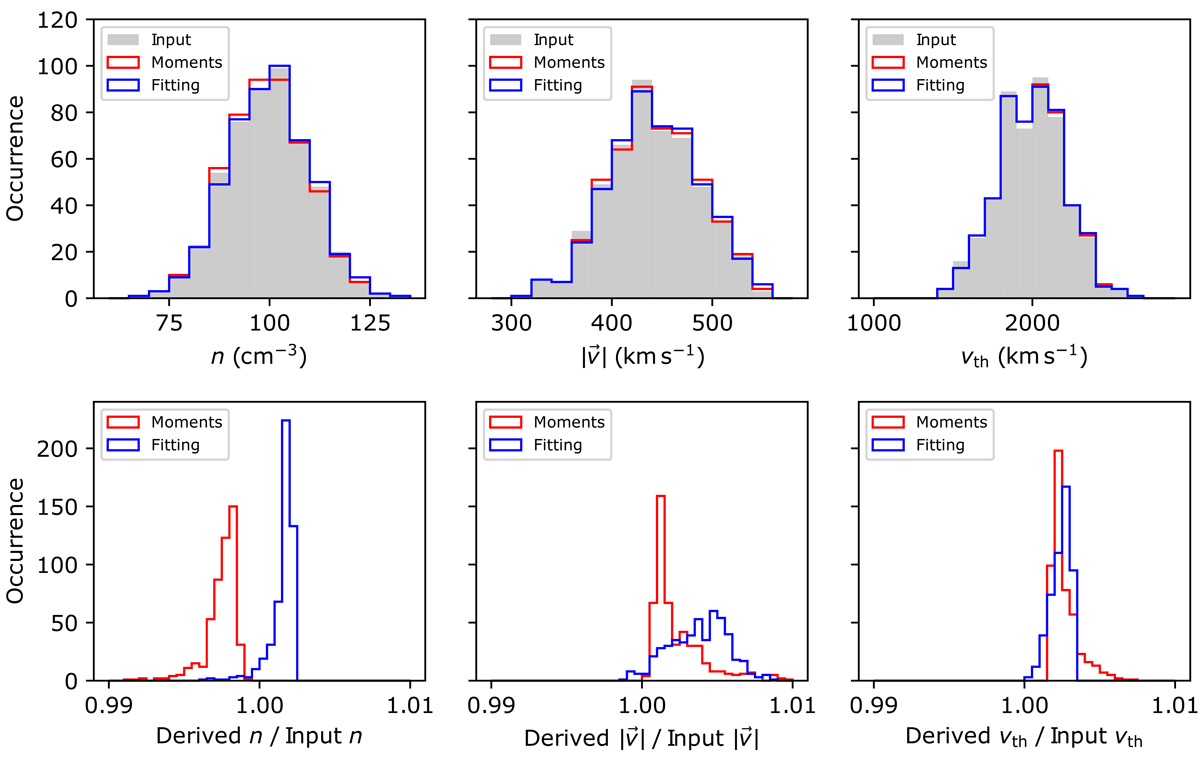
Comparison between input and output plasma parameters. Top left: histogram of (gray) input, (red) derived by moments, and (blue) derived by fit plasma density. Top middle: histogram of the input and derived plasma speed and (top right) the input and derived thermal speed in the same format. Bottom left: Histogram of (red) derived by moments and (blue) derived by fitting density divided by the input density. Bottom middle: Histogram of the derived over input speed. Bottom right: histogram of the derived over input thermal speed in the same format.
Current usage metrics show cumulative count of Article Views (full-text article views including HTML views, PDF and ePub downloads, according to the available data) and Abstracts Views on Vision4Press platform.
Data correspond to usage on the plateform after 2015. The current usage metrics is available 48-96 hours after online publication and is updated daily on week days.
Initial download of the metrics may take a while.