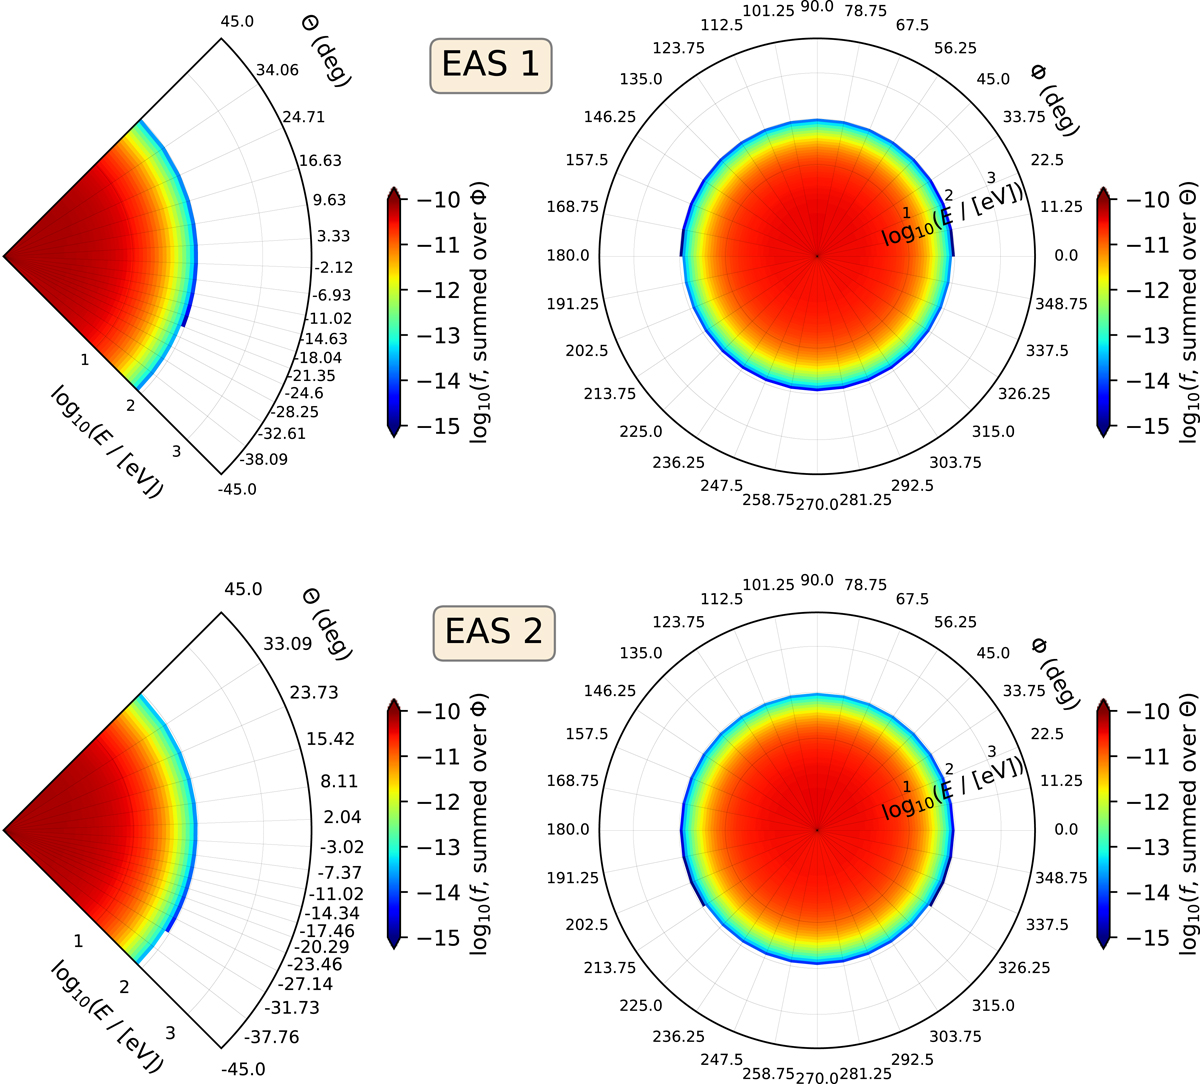
Fig. 3.
Download original image
Model distribution function constructed in the (top) SWA-EAS 1 and (bottom) SWA-EAS 2 head. For this model, we use the input density n = 100 cm−3, bulk velocity v = 440 km s−1, and direction along the x-axis of the instrument frame, and vth = 2000 km s−1. In the left panel of each row, we show the model distribution function as a function of energy and elevation angle, summed over azimuth. The right panels show the model distribution as a function of energy and azimuth, summed over elevation.
Current usage metrics show cumulative count of Article Views (full-text article views including HTML views, PDF and ePub downloads, according to the available data) and Abstracts Views on Vision4Press platform.
Data correspond to usage on the plateform after 2015. The current usage metrics is available 48-96 hours after online publication and is updated daily on week days.
Initial download of the metrics may take a while.