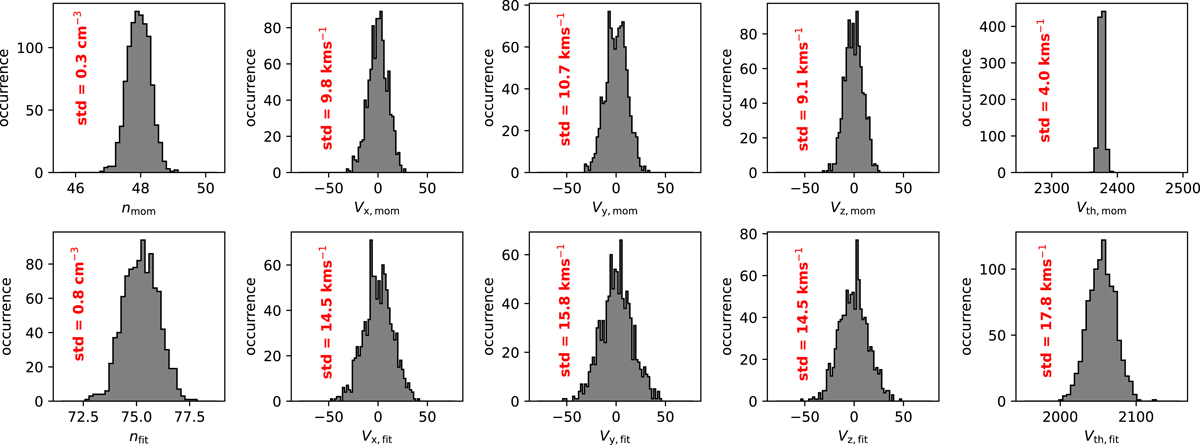
Fig. C.1.
Download original image
Histograms of the electrons plasma parameters derived by (top) statistical moments and by (bottom) fitting analysis of 1000 simulated plasma samples of plasma with n = 75 cm−3 and Vth = 2050 km s−1. In our simulations, we assume that the number of counts follows the Poisson distribution. In each panel, we show the standard deviation of the histogram, which we consider as the typical statistical error for the corresponding parameter. Those are used as error bars in Figures 8 and 9.
Current usage metrics show cumulative count of Article Views (full-text article views including HTML views, PDF and ePub downloads, according to the available data) and Abstracts Views on Vision4Press platform.
Data correspond to usage on the plateform after 2015. The current usage metrics is available 48-96 hours after online publication and is updated daily on week days.
Initial download of the metrics may take a while.