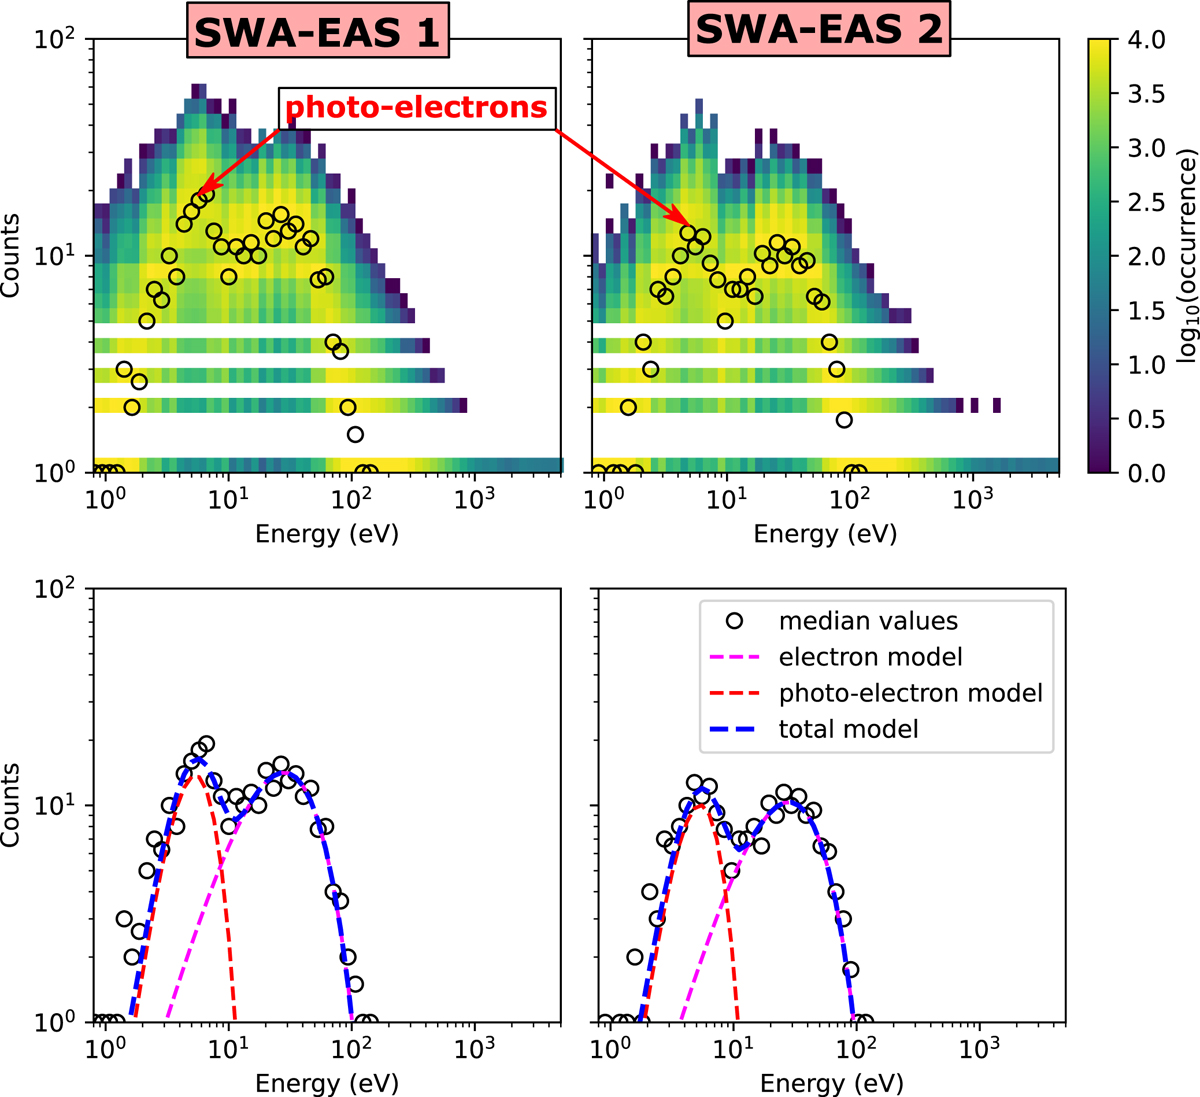
Fig. A.1.
Download original image
Occurrence of raw counts per energy channel. Top left: Distribution of counts as a function of energy for the observations obtained from 14:50:19UT to 17:35:19UT on 15-06-2020, by EAS 1 and (top right) by EAS 2. Each bin of the histogram shows the sum of the counts within the time interval, elevation bins and azimuth sectors. The black data-points show the median value of counts in each energy bin. Bottom left: Median value of counts in each energy bin as measured by EAS 1. Bottom right: Median value of counts in each energy bin as measured by EAS2. The red and magenta dashed lines show models of the photo-electrons and thermal electrons respectively. Photo-electrons and thermal electrons are well separated 10 eV.
Current usage metrics show cumulative count of Article Views (full-text article views including HTML views, PDF and ePub downloads, according to the available data) and Abstracts Views on Vision4Press platform.
Data correspond to usage on the plateform after 2015. The current usage metrics is available 48-96 hours after online publication and is updated daily on week days.
Initial download of the metrics may take a while.