Fig. 10.
Download original image
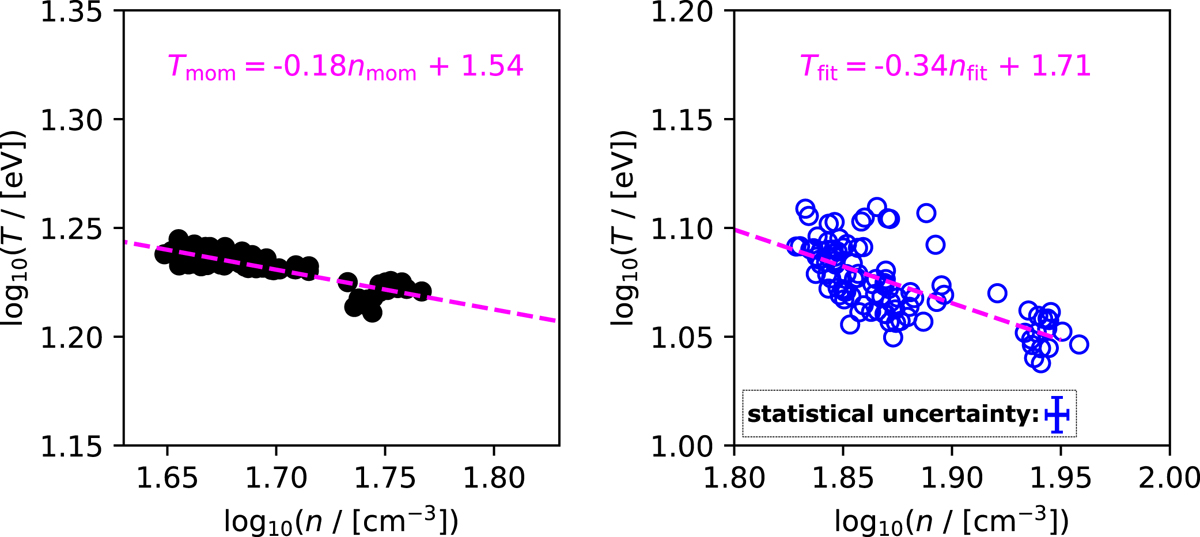
log10T vs. log10n of solar wind electrons, as derived by (left) statistical moments analysis and (right) fitting analysis of the first 100 3D-VDFs obtained in 15-06-2020. The magenta dashed lines in each plot are isobaric lines. There is a clear anti-correlation between log10(T) and log10(n). However, the small value of the slope describing the relationship between the observables, indicates a nearly isothermal electron plasma. The statistical error bar in the left panel is not shown as it is comparable to the data symbol size.
Current usage metrics show cumulative count of Article Views (full-text article views including HTML views, PDF and ePub downloads, according to the available data) and Abstracts Views on Vision4Press platform.
Data correspond to usage on the plateform after 2015. The current usage metrics is available 48-96 hours after online publication and is updated daily on week days.
Initial download of the metrics may take a while.