Fig. 8
Download original image
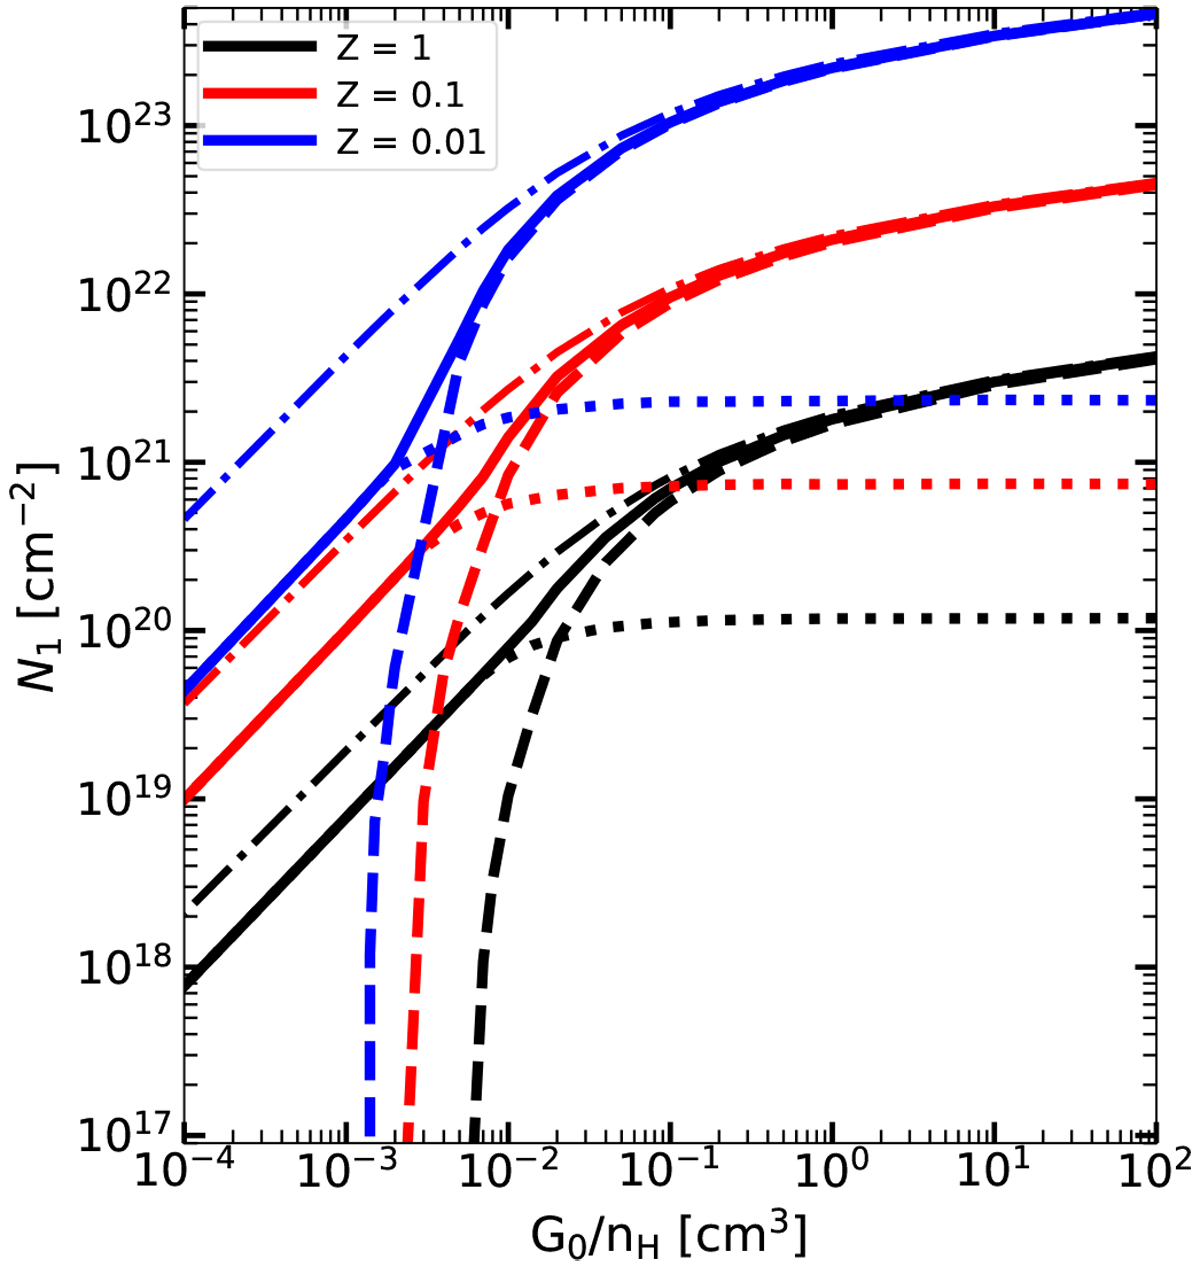
N1 integrated over the atomic region (dashed lines), over the molecular region (dotted lines) and over the whole PDR, N1,tot (solid lines) as functions of the G0∕nH ratio for, from top to bottom, respectively, Z′ = 0.01 in blue, 0.1 in red and 1 in black, obtained for vIF = 0.1 km s−1. The dotted-dashed lines are the static results.
Current usage metrics show cumulative count of Article Views (full-text article views including HTML views, PDF and ePub downloads, according to the available data) and Abstracts Views on Vision4Press platform.
Data correspond to usage on the plateform after 2015. The current usage metrics is available 48-96 hours after online publication and is updated daily on week days.
Initial download of the metrics may take a while.