Fig. 10
Download original image
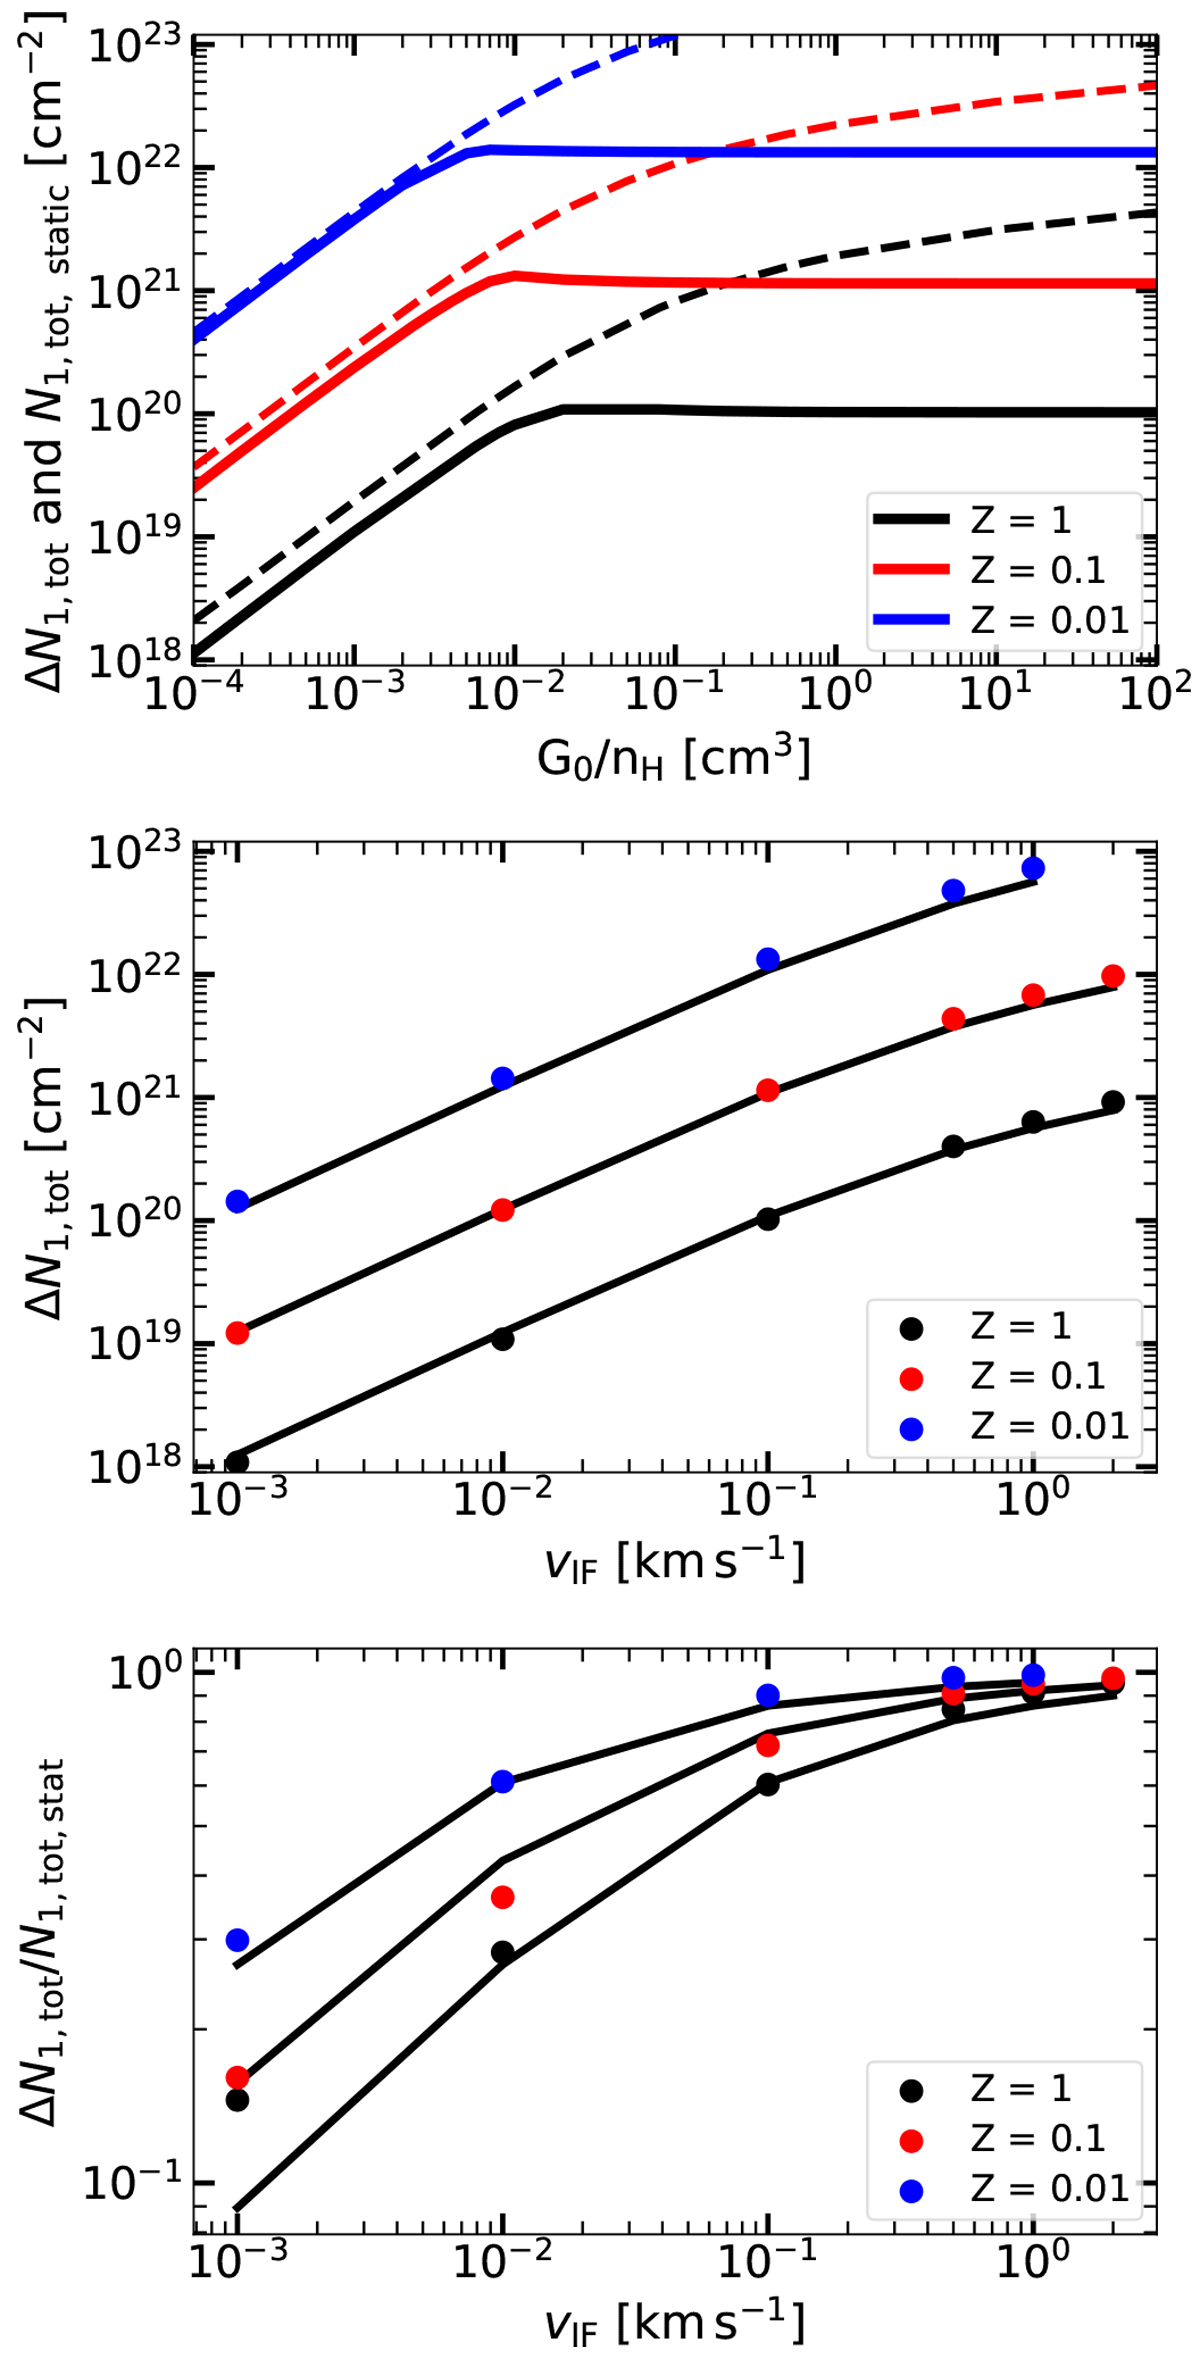
Top panel: ΔN1,tot (solid lines) as a function of the G0∕nH ratio for vIF = 0.1 km s−1 and for Z′ = 0.01 (blue), Z′ = 0.1 (red), and Z′ = 1 (black). The static N1,tot are the dashed lines. Middle panel: ΔN1,tot between static and advection cases as a function of vIF. The points were obtained for a strong field of G0∕nH = 102 cm3. The black lines are the analytical formula presented in Eq. (19). Bottom panel: Same as middle panel but for a weak field of G0∕nH = 10−5 cm3. In this limit, Eq. (19) is a fit made on all the points.
Current usage metrics show cumulative count of Article Views (full-text article views including HTML views, PDF and ePub downloads, according to the available data) and Abstracts Views on Vision4Press platform.
Data correspond to usage on the plateform after 2015. The current usage metrics is available 48-96 hours after online publication and is updated daily on week days.
Initial download of the metrics may take a while.