Open Access
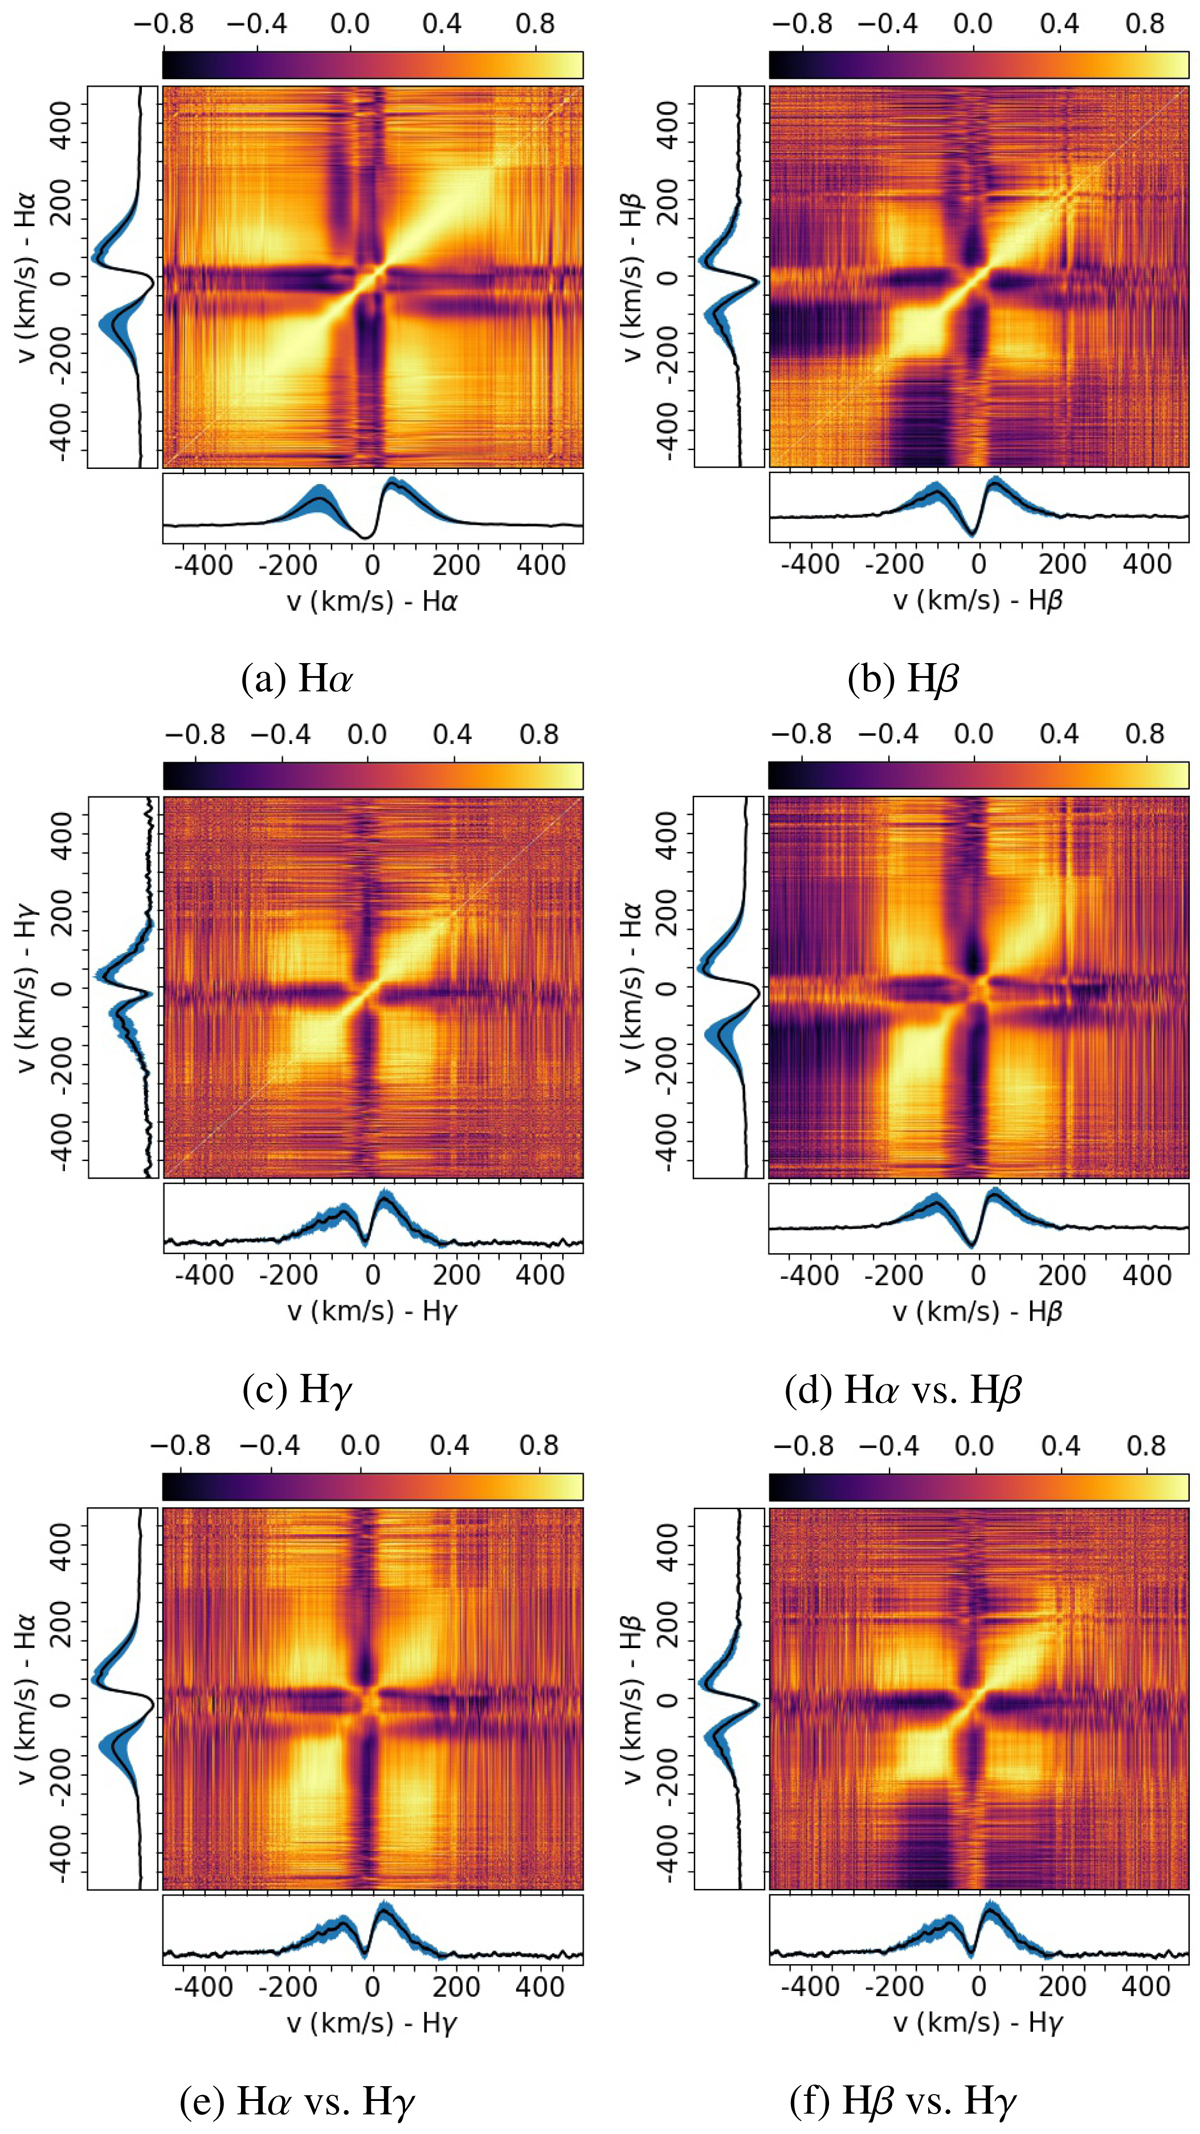
Fig. 9.
Download original image
Correlation matrix of residual Balmer lines. Light yellow represents a strong correlation, dark purple a strong anti-correlation, and orange means no correlation. The bottom and left inserts in each panel show the mean residual line profile (black) and its variance (blue) for each axis.
Current usage metrics show cumulative count of Article Views (full-text article views including HTML views, PDF and ePub downloads, according to the available data) and Abstracts Views on Vision4Press platform.
Data correspond to usage on the plateform after 2015. The current usage metrics is available 48-96 hours after online publication and is updated daily on week days.
Initial download of the metrics may take a while.