Open Access
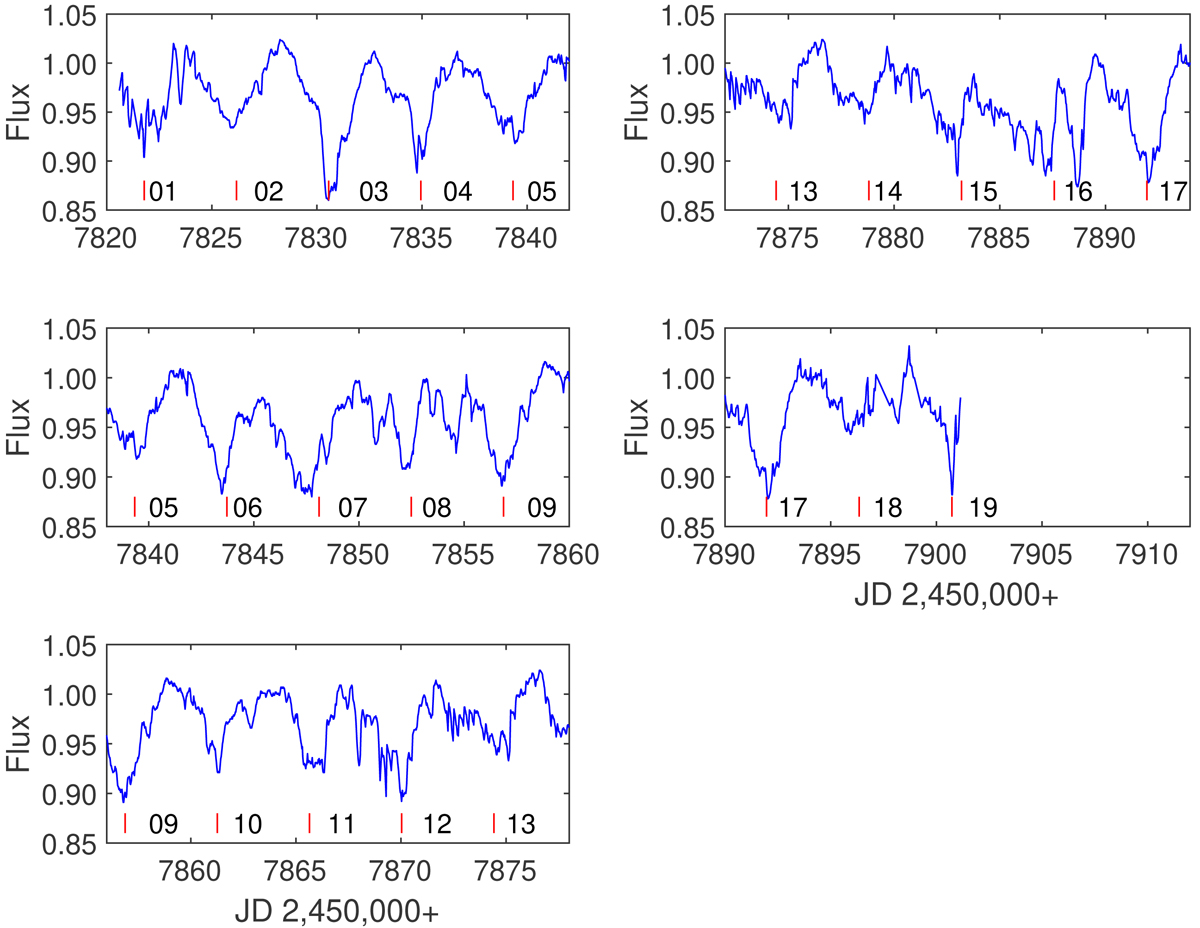
Fig. A.1.
Download original image
K2-light curve of V807 Tau split into sections of five successive minima. Each panel overlaps the previous one by one minimum. The red lines identify the location of the minima, separated by a constant time interval corresponding to the rotational period of the star.
Current usage metrics show cumulative count of Article Views (full-text article views including HTML views, PDF and ePub downloads, according to the available data) and Abstracts Views on Vision4Press platform.
Data correspond to usage on the plateform after 2015. The current usage metrics is available 48-96 hours after online publication and is updated daily on week days.
Initial download of the metrics may take a while.