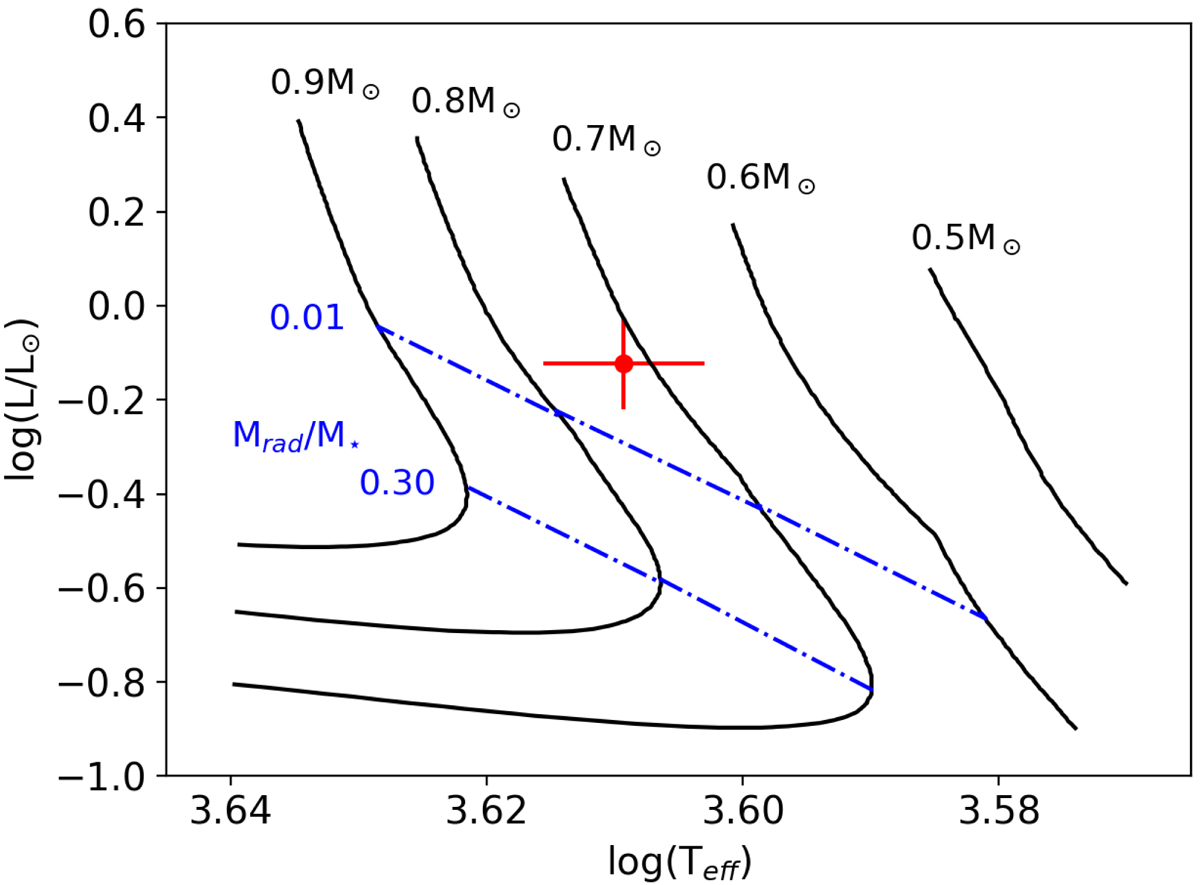
Fig. 2.
Download original image
V807 Tau’s position in the HR diagram. The red cross illustrates V807 Tau’s position with corresponding uncertainties. The black curves are the evolutionary tracks from Baraffe et al. (1998) PMS models, with the corresponding mass indicated on the top. The blue curves show the position where the radiative core of the star reaches 30% and 1% of the stellar mass.
Current usage metrics show cumulative count of Article Views (full-text article views including HTML views, PDF and ePub downloads, according to the available data) and Abstracts Views on Vision4Press platform.
Data correspond to usage on the plateform after 2015. The current usage metrics is available 48-96 hours after online publication and is updated daily on week days.
Initial download of the metrics may take a while.