Open Access
Fig. 16.
Download original image
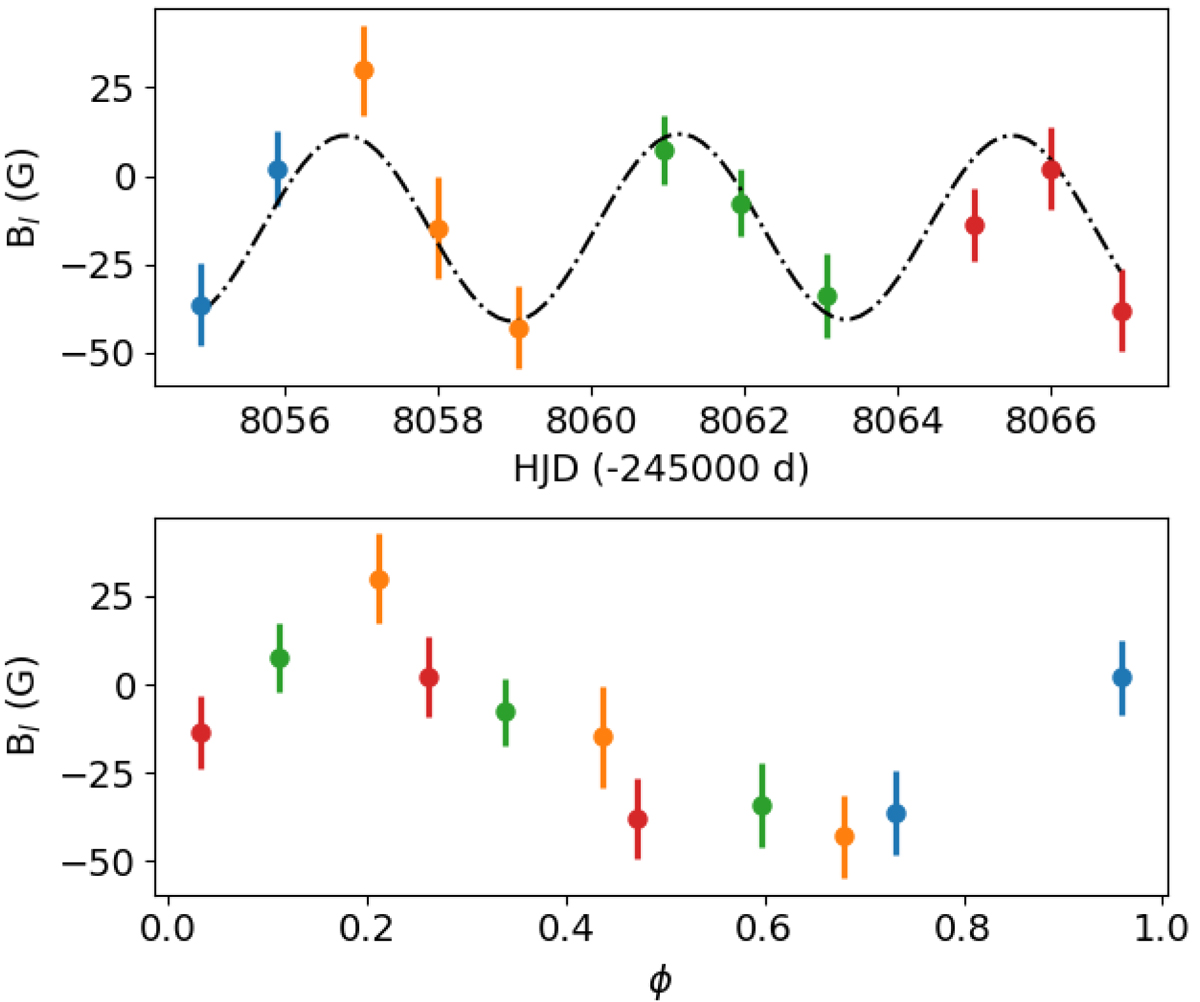
Surface-averaged longitudinal magnetic field is plotted as a function of date in the top panel and as a function of rotational phase in the bottom panel, using the ephemerides described in Sect. 3.2. The dash-dotted curve in the top panel is the best sinusoid fit. The colors indicate successive rotation cycles.
Current usage metrics show cumulative count of Article Views (full-text article views including HTML views, PDF and ePub downloads, according to the available data) and Abstracts Views on Vision4Press platform.
Data correspond to usage on the plateform after 2015. The current usage metrics is available 48-96 hours after online publication and is updated daily on week days.
Initial download of the metrics may take a while.