Fig. 5
Download original image
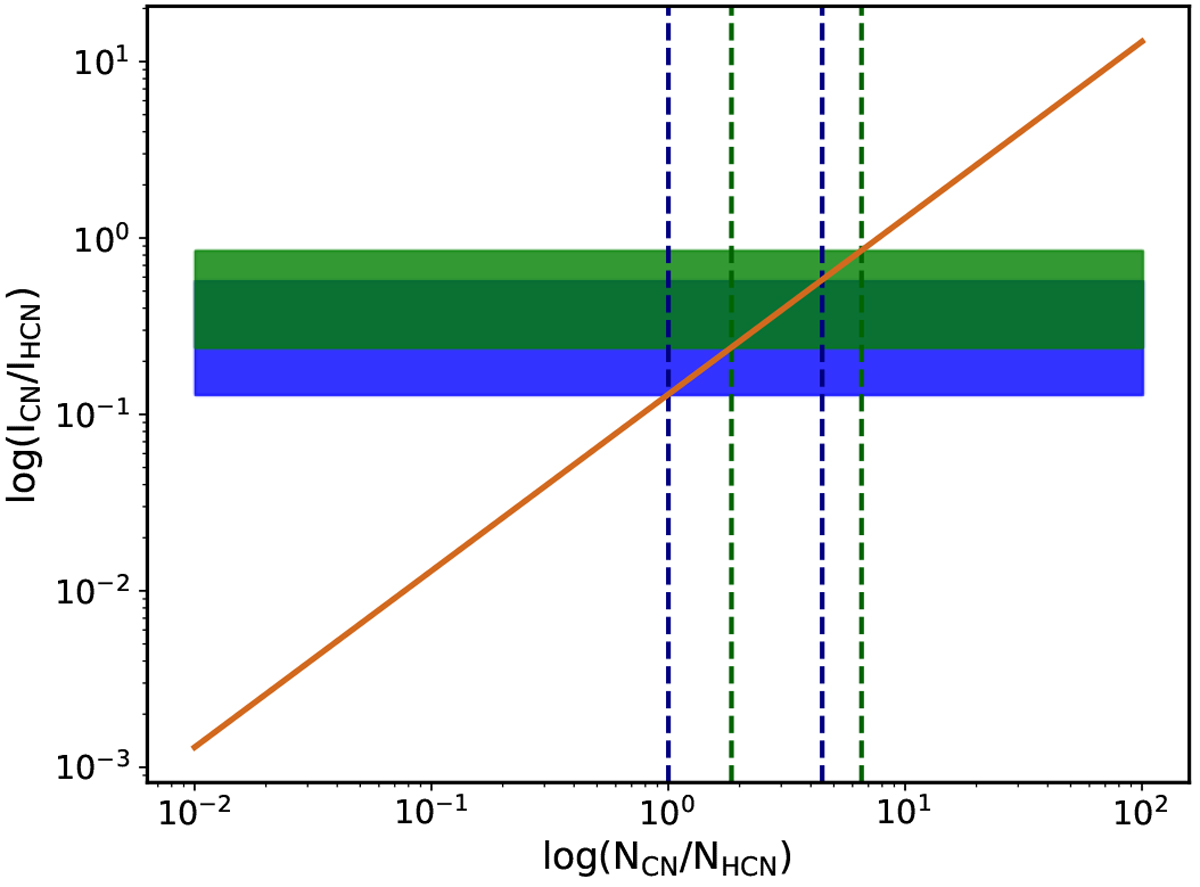
Ratio of CN to HCN column densities obtained with RADEX for nH = 105 cm−3 and Tkin = 50 K for a range of line intensity ratios (orange line). The observed line intensity ratio is shown as a rectangle: light green correspondsto the values observed at the protostar position, blue to the outflow positions, and dark green to both regions. Column density ranges are indicated by black and navy dashed lines for protostars and outflow positions, respectively.
Current usage metrics show cumulative count of Article Views (full-text article views including HTML views, PDF and ePub downloads, according to the available data) and Abstracts Views on Vision4Press platform.
Data correspond to usage on the plateform after 2015. The current usage metrics is available 48-96 hours after online publication and is updated daily on week days.
Initial download of the metrics may take a while.