Fig. 3
Download original image
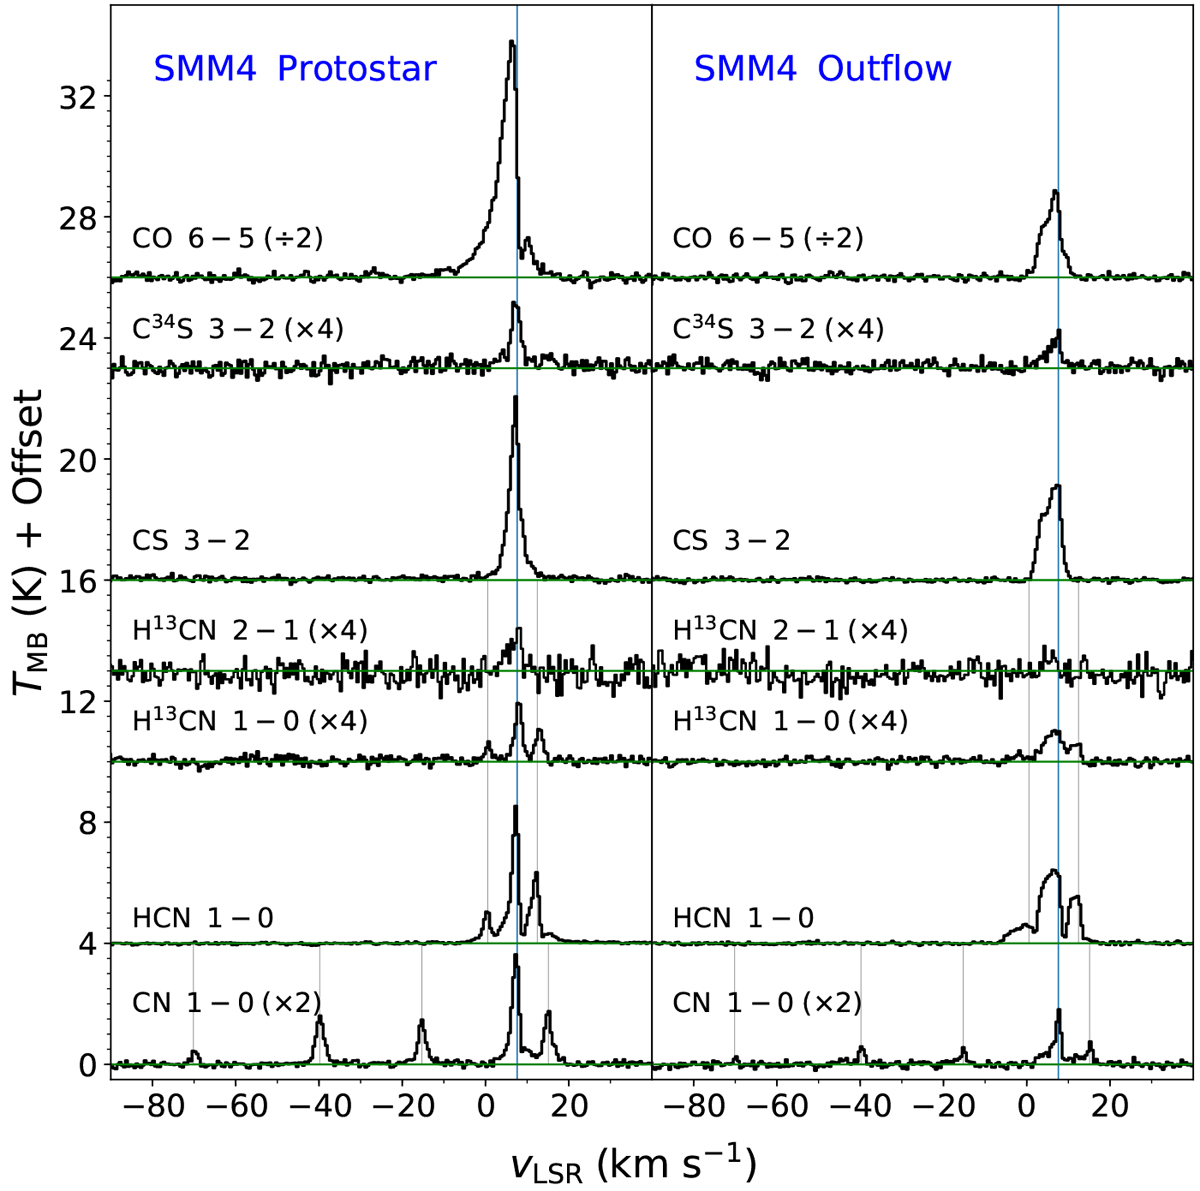
Line profiles of CO 6–5, C34S 3–2, CS 3–2, H13CN 2–1, H13 CN 1–0, HCN 1–0, and CN 1–0 at the protostellar position Ser SMM4 (left) and the associated outflow position no. 3 (right). Theblue vertical lines show the main line component and the gray lines show the hyperfine split components. The maps in Fig. 2 show the sum of all hyperfine components detected in the spectra of HCN and CN.
Current usage metrics show cumulative count of Article Views (full-text article views including HTML views, PDF and ePub downloads, according to the available data) and Abstracts Views on Vision4Press platform.
Data correspond to usage on the plateform after 2015. The current usage metrics is available 48-96 hours after online publication and is updated daily on week days.
Initial download of the metrics may take a while.