Open Access
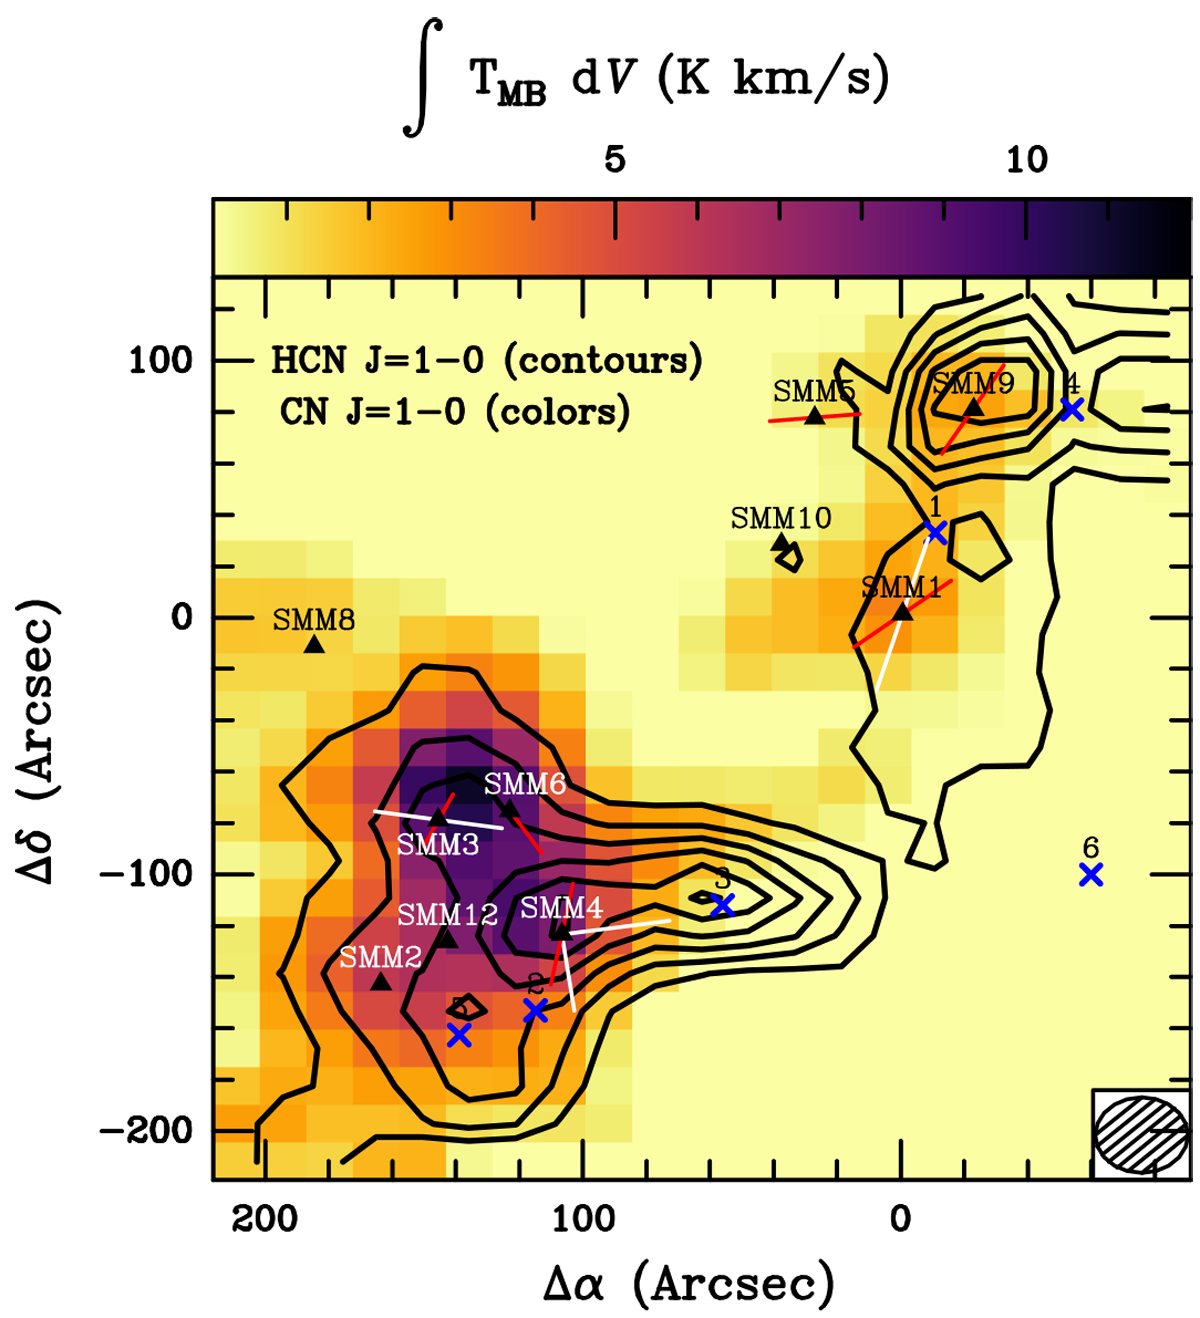
Fig. 10
Download original image
Map of CN 1–0 (colors) and HCN 1–0 (contours) in the Serpens Main. The labels are the same as in Fig. 2. Contour levels start at 8 K km s−1 with steps of 3 K km s−1. The CN emission has been resampled to the beam size of HCN to compare the same emitting regions.
Current usage metrics show cumulative count of Article Views (full-text article views including HTML views, PDF and ePub downloads, according to the available data) and Abstracts Views on Vision4Press platform.
Data correspond to usage on the plateform after 2015. The current usage metrics is available 48-96 hours after online publication and is updated daily on week days.
Initial download of the metrics may take a while.