Open Access
Fig. 1
Download original image
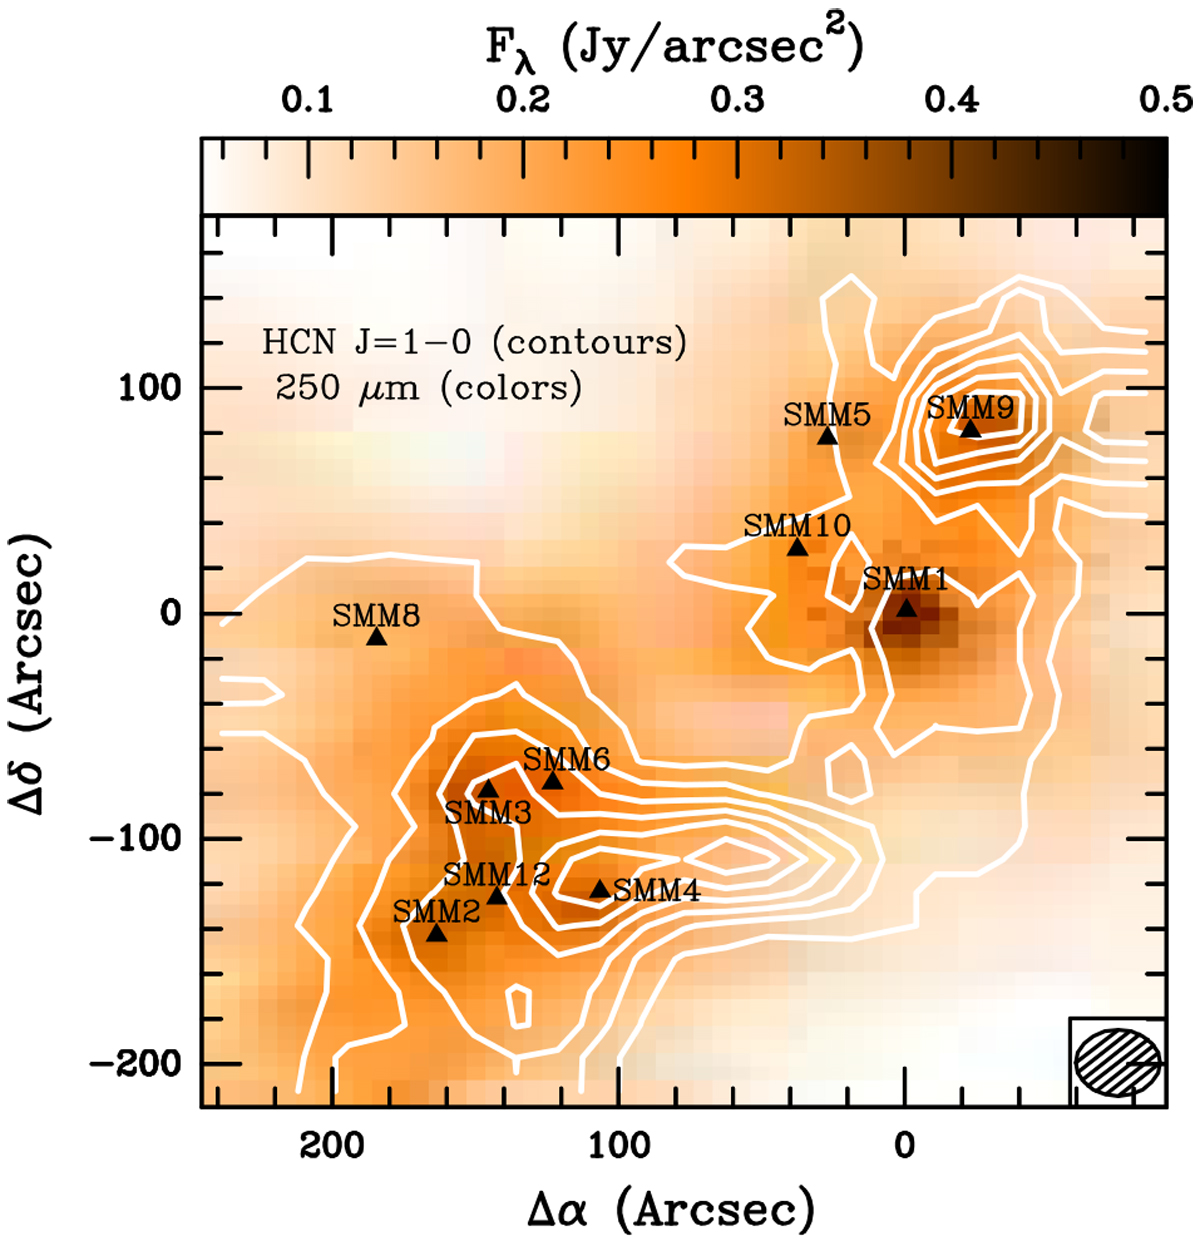
EMIR map of HCN 1–0 (contours) on top of the continuum emission at 250 μm from Herschel/SPIRE. The HCN contours start at 6 K km s−1 (20 σ) and are drawn in steps of 3 K km s−1 (10 σ). The protostellar properties are shown in Table 1.
Current usage metrics show cumulative count of Article Views (full-text article views including HTML views, PDF and ePub downloads, according to the available data) and Abstracts Views on Vision4Press platform.
Data correspond to usage on the plateform after 2015. The current usage metrics is available 48-96 hours after online publication and is updated daily on week days.
Initial download of the metrics may take a while.