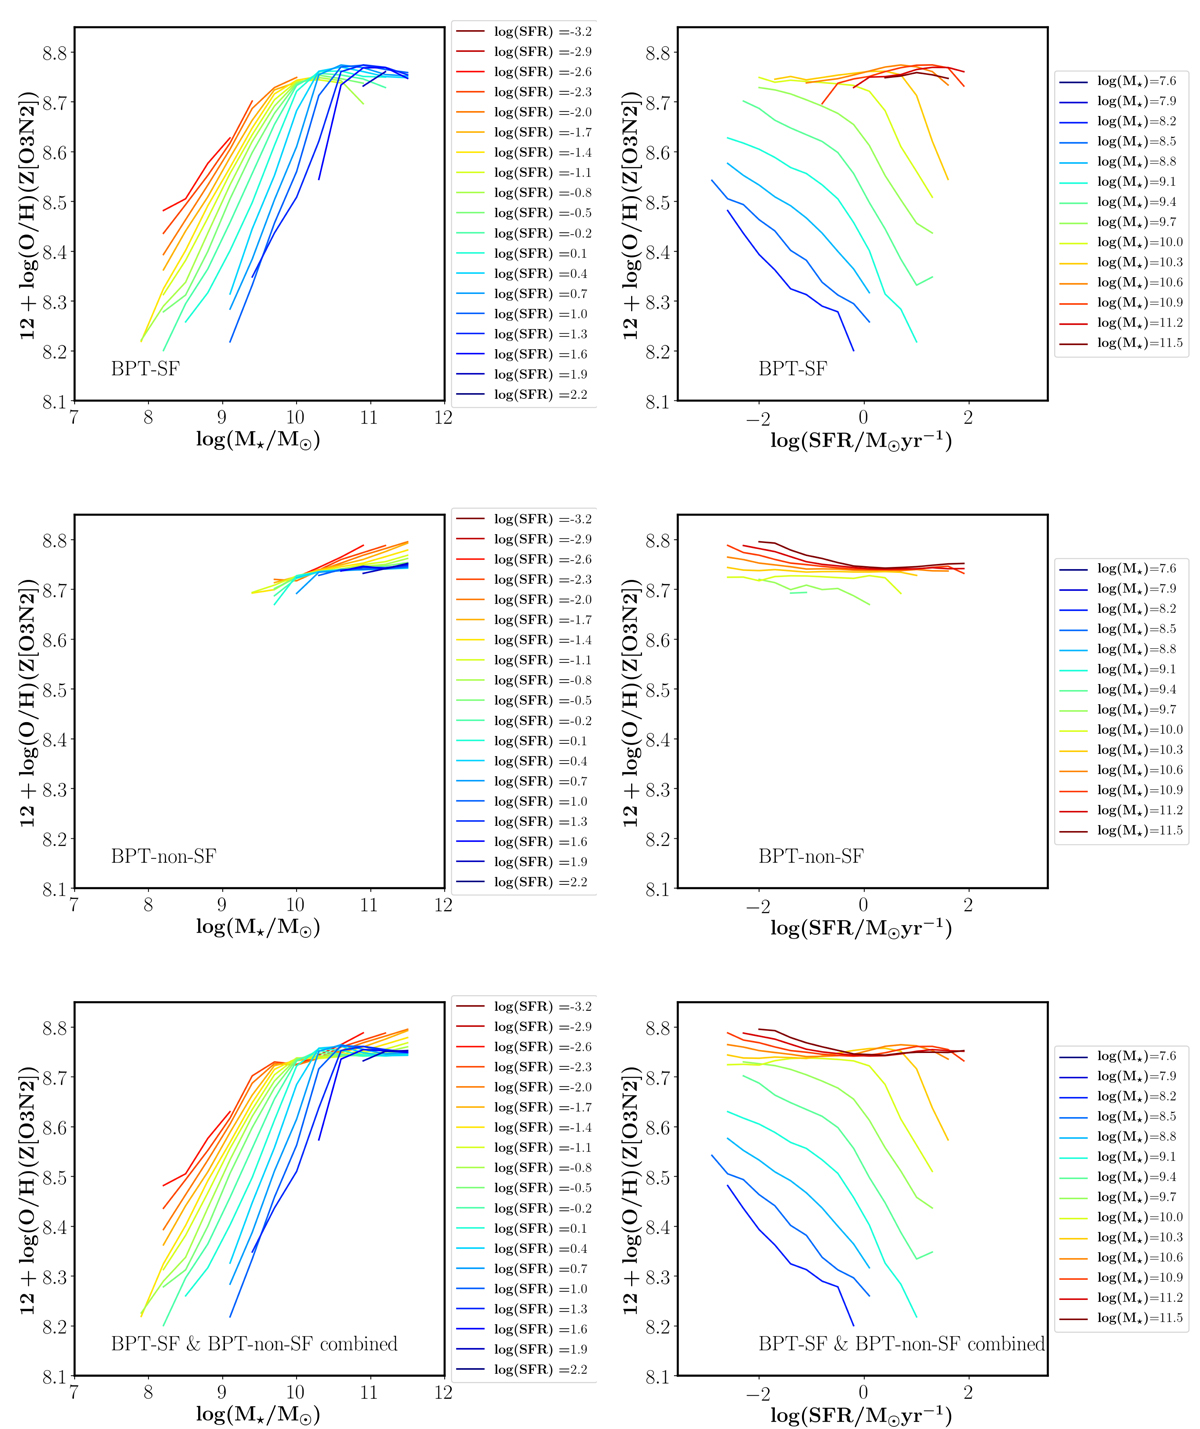
Fig. 3.
Download original image
Left-hand panel: gas-phase metallicity (12 + log(O/H)) versus stellar mass (log M⋆/M⊙) for BPT-SF galaxies (upper-panel), BPT-non-SF galaxies (middle panel), and their combined sample (bottom panel). The coloured curves on each plot in the left-hand panel correspond to median metallicities estimated in the bins of log M⋆/M⊙ and log SFR, colour coded with respect to log SFR in a given bin. Right-hand panel: gas-phase metallicity (12 + log(O/H)) versus log SFR for BPT-SF (upper-panel), BPT-non-SF (middle panel), and their combined sample (bottom panel). The coloured curves on each plot in the right-hand panel correspond to the median metallicities estimated in bins of log SFR and log M⋆/M⊙. The [N II]-BPT classification along with the maximum star-burst line from Kauffmann et al. (2003a) is used to separate SF (upper-panel) and non-SF galaxies (middle panel). The gas-phase metallicities of BPT-SF (upper-panel) and BPT-non-SF (middle panel) galaxies are obtained using the empirical calibrations involving the O3N2 diagnostic provided in Curti et al. (2017) and Kumari et al. (2019), respectively. The bottom panel consists of both BPT-SF and BPT-non-SF galaxies and hence their metallicities are obtained from both SF (Curti et al. 2017) and non-SF (Kumari et al. 2019) calibrations, depending on the type of galaxy populations.
Current usage metrics show cumulative count of Article Views (full-text article views including HTML views, PDF and ePub downloads, according to the available data) and Abstracts Views on Vision4Press platform.
Data correspond to usage on the plateform after 2015. The current usage metrics is available 48-96 hours after online publication and is updated daily on week days.
Initial download of the metrics may take a while.