Free Access
Fig. 1
Download original image
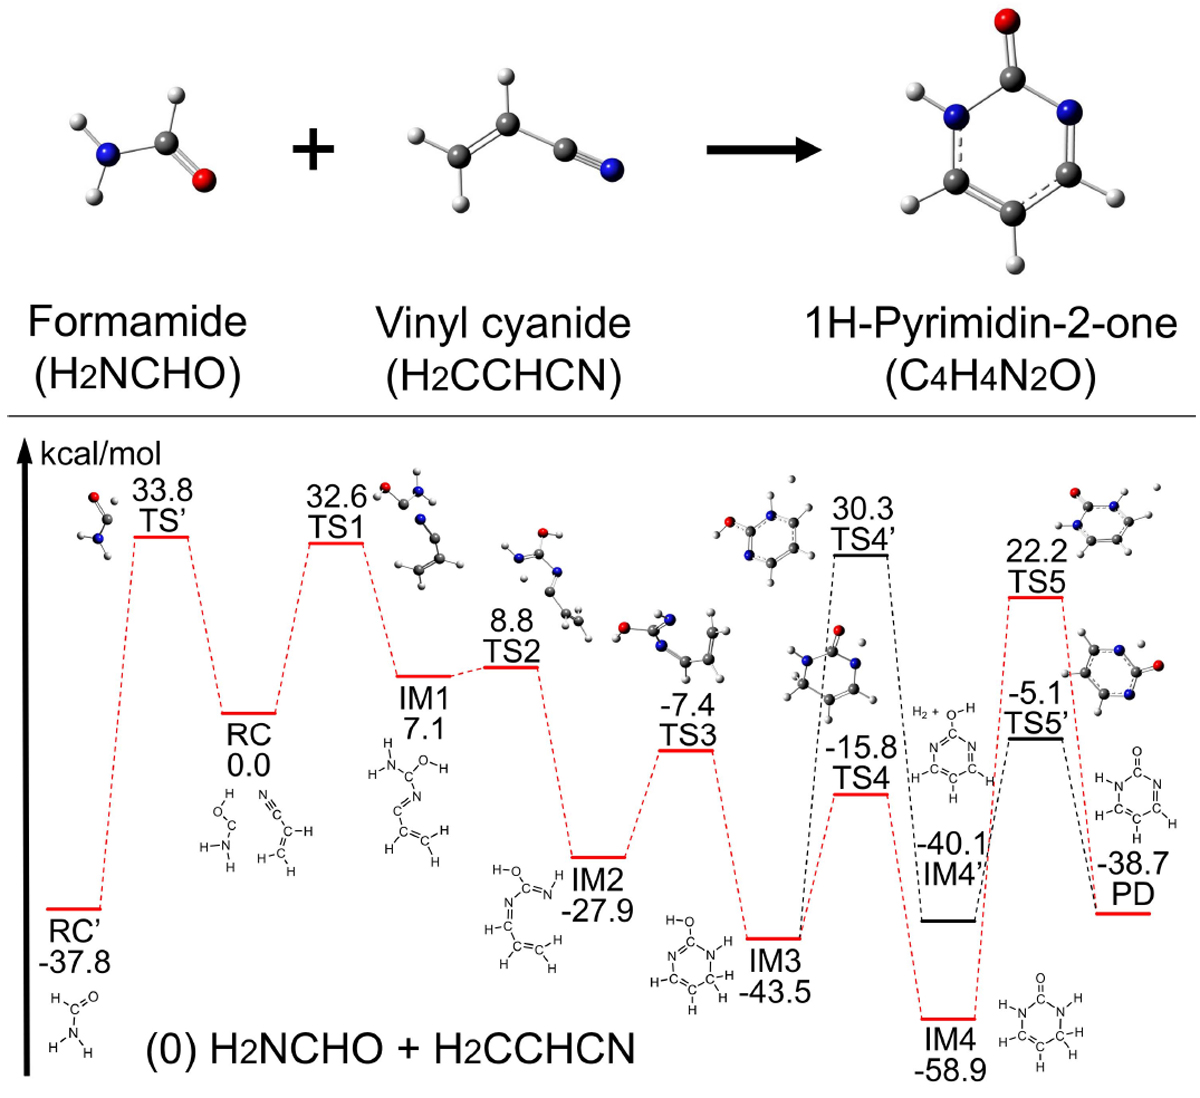
Potential energy diagram for the two most likely reactions between H2NCHO and H2CCHCN in single collision events (Reaction 0). The most energetically favorable reaction pathway is highlighted in red, with the second one in black.
Current usage metrics show cumulative count of Article Views (full-text article views including HTML views, PDF and ePub downloads, according to the available data) and Abstracts Views on Vision4Press platform.
Data correspond to usage on the plateform after 2015. The current usage metrics is available 48-96 hours after online publication and is updated daily on week days.
Initial download of the metrics may take a while.