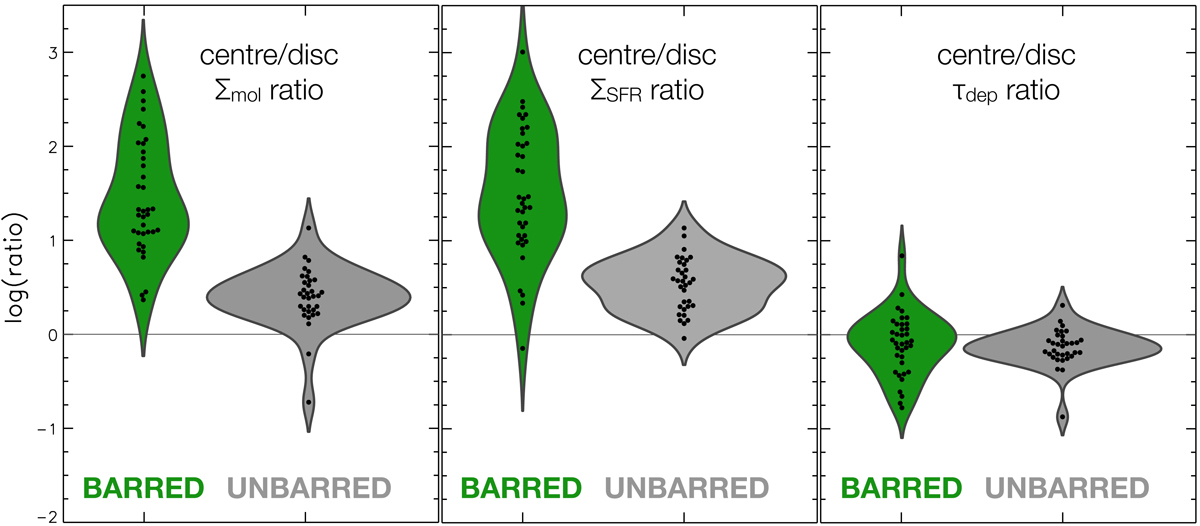
Fig. 9.
Download original image
Violin plots showing the contrast in molecular gas and star formation rate surface density, as well as depletion time, between centres and discs. The sample is split into barred (green) and unbarred galaxies (grey).
Current usage metrics show cumulative count of Article Views (full-text article views including HTML views, PDF and ePub downloads, according to the available data) and Abstracts Views on Vision4Press platform.
Data correspond to usage on the plateform after 2015. The current usage metrics is available 48-96 hours after online publication and is updated daily on week days.
Initial download of the metrics may take a while.