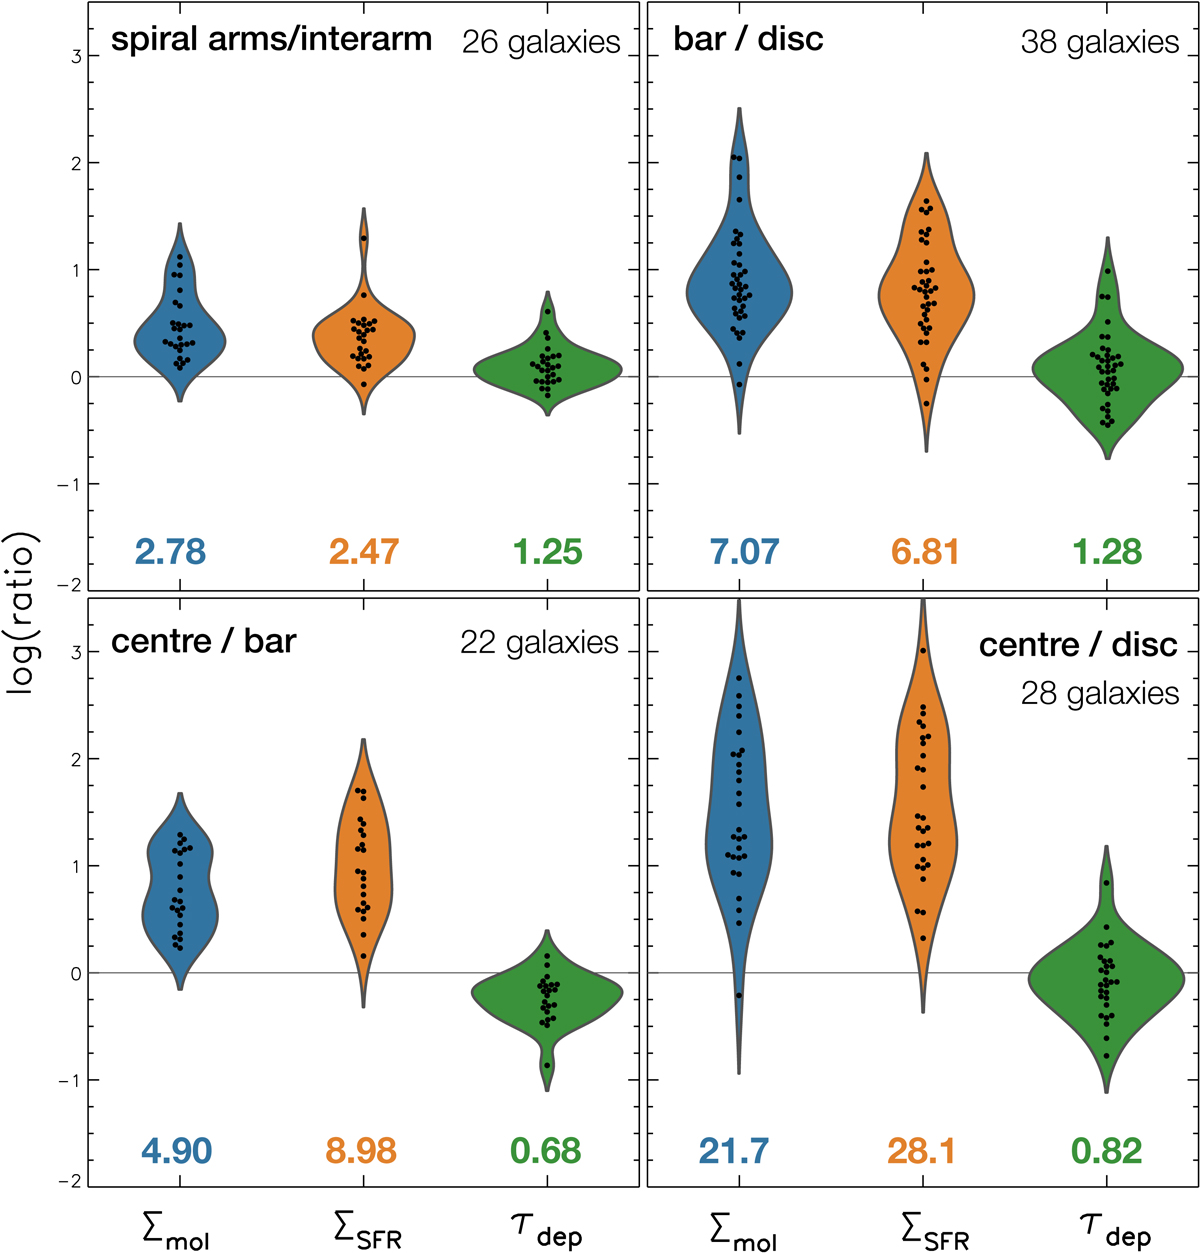
Fig. 8.
Download original image
Violin plots showing the distribution of contrasts between different pairs of environments in terms of mean molecular gas surface density (blue), star formation rate surface density (orange), as well as depletion time (green). These contrasts are calculated within each galaxy (when the pair of structures exists) and each contrast results in a data point, plotted as a black circle. We consider the ratios between spiral arms and interarm (top left); bar and disc (top right), where discs include spiral arms, interarm regions, and discs without spiral masks; centre and bar (bottom left); and centre and disc (bottom right), again including spirals, interarm, and discs without spiral masks. The numbers under the violin plots indicate the median ratio in linear scale. The black dots show the distribution of the ratios; an arbitrary offset is introduced in the horizontal axis to improve visibility.
Current usage metrics show cumulative count of Article Views (full-text article views including HTML views, PDF and ePub downloads, according to the available data) and Abstracts Views on Vision4Press platform.
Data correspond to usage on the plateform after 2015. The current usage metrics is available 48-96 hours after online publication and is updated daily on week days.
Initial download of the metrics may take a while.