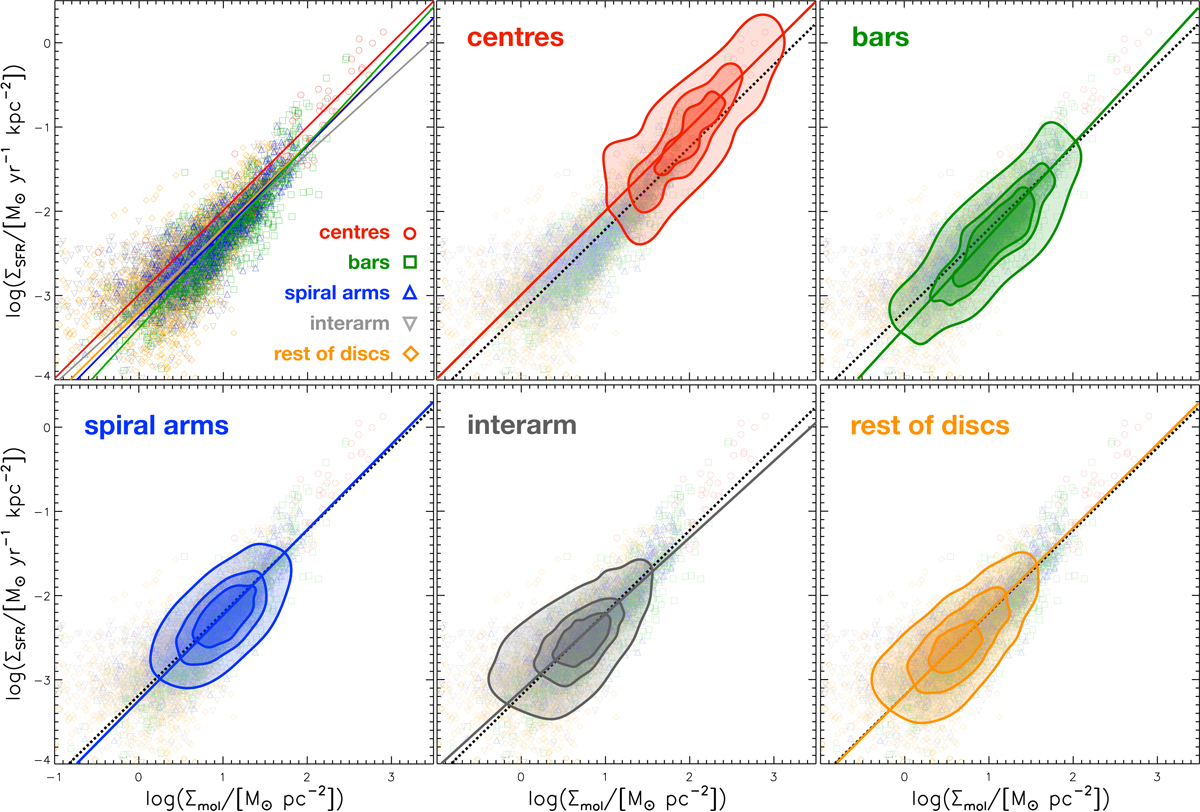
Fig. 7.
Download original image
Molecular Kennicutt–Schmidt relation for kpc-scale measurements across the PHANGS–ALMA sample of galaxies. The straight colour lines represent the best bisector fit to the data for each environment (for reference, the black dotted line represents the fit to all the data). For clarity, the various panels show the same plot with data point density contours for each environment and the corresponding bisector fit (contours encompass 30%, 50%, and 80% of all data points in each category).
Current usage metrics show cumulative count of Article Views (full-text article views including HTML views, PDF and ePub downloads, according to the available data) and Abstracts Views on Vision4Press platform.
Data correspond to usage on the plateform after 2015. The current usage metrics is available 48-96 hours after online publication and is updated daily on week days.
Initial download of the metrics may take a while.