Fig. 6.
Download original image
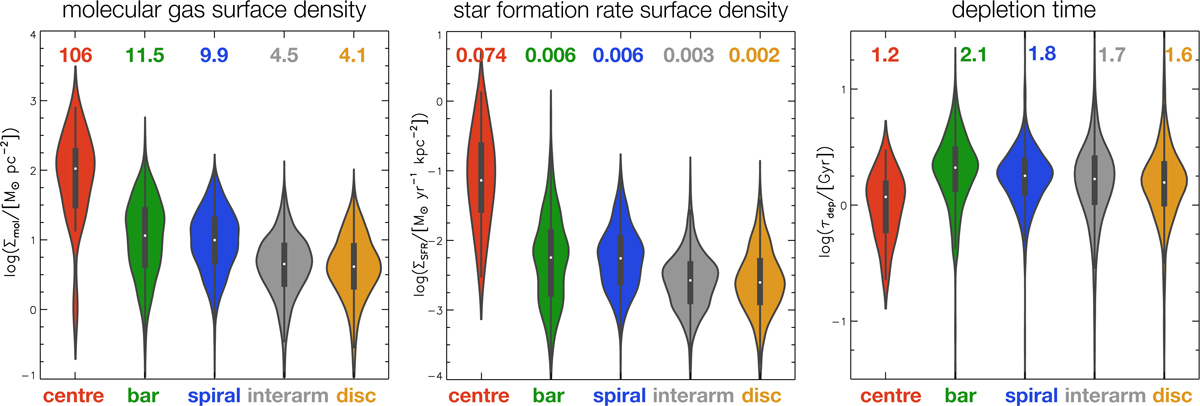
Violin plots showing the distribution of molecular gas and star formation rate surface densities measured in 1 kpc apertures, as well as the resulting depletion times (τdep = Σmol/ΣSFR). The different colours indicate the range of environments that we examine in this paper. The numbers on top of the violin plots indicate the median value in linear scale. The thick black bar inside each violin plot shows the interquartile range, the white dot indicates the median, and the thin black lines show the span of data points beyond the black bar that lie within 1.5 times the interquartile range.
Current usage metrics show cumulative count of Article Views (full-text article views including HTML views, PDF and ePub downloads, according to the available data) and Abstracts Views on Vision4Press platform.
Data correspond to usage on the plateform after 2015. The current usage metrics is available 48-96 hours after online publication and is updated daily on week days.
Initial download of the metrics may take a while.