Fig. 4.
Download original image
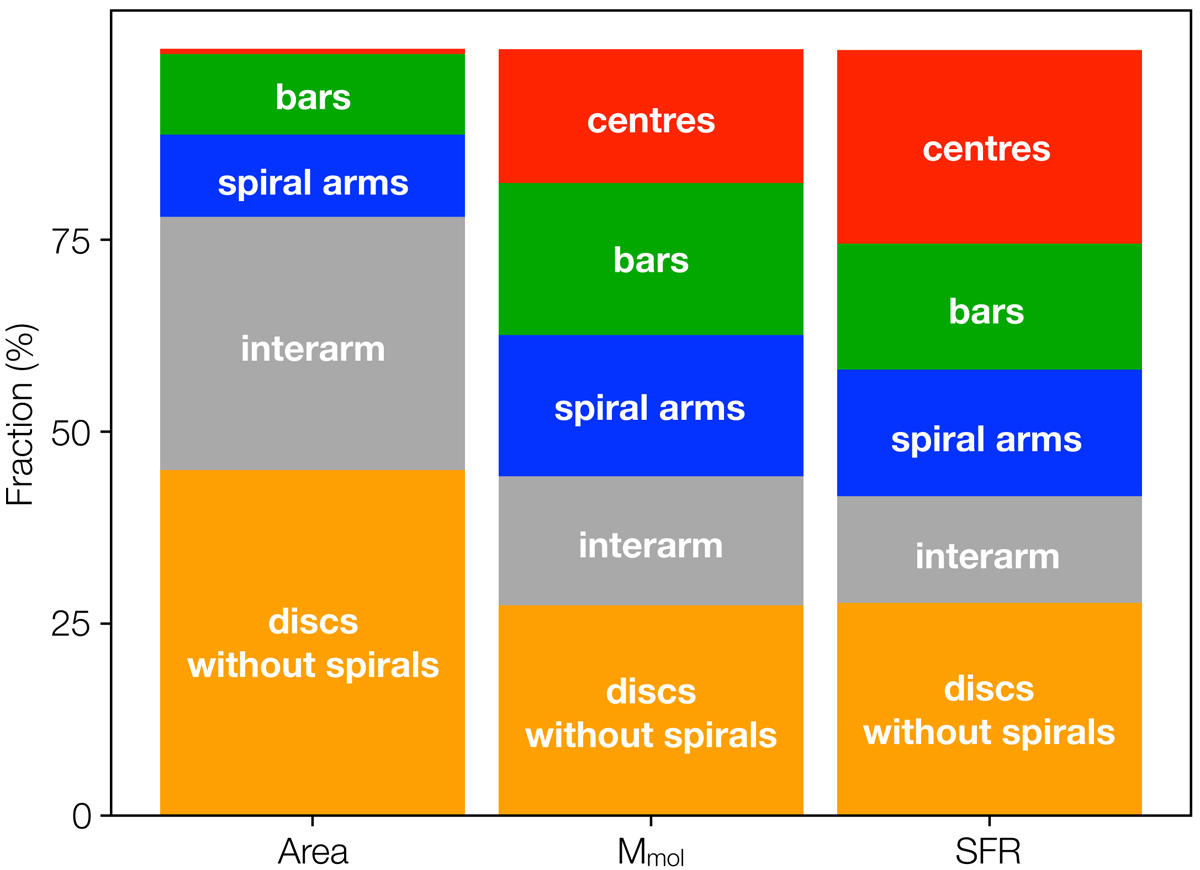
Stacked bar charts showing the relative distribution of area, integrated molecular gas mass, and integrated star formation rates in each of the environments that we consider in this paper and across the entire PHANGS–ALMA sample of galaxies. These measurements consider the full resolution of the data as explained in Sect. 4.1 and are limited to the ALMA field of view.
Current usage metrics show cumulative count of Article Views (full-text article views including HTML views, PDF and ePub downloads, according to the available data) and Abstracts Views on Vision4Press platform.
Data correspond to usage on the plateform after 2015. The current usage metrics is available 48-96 hours after online publication and is updated daily on week days.
Initial download of the metrics may take a while.