Fig. 2.
Download original image
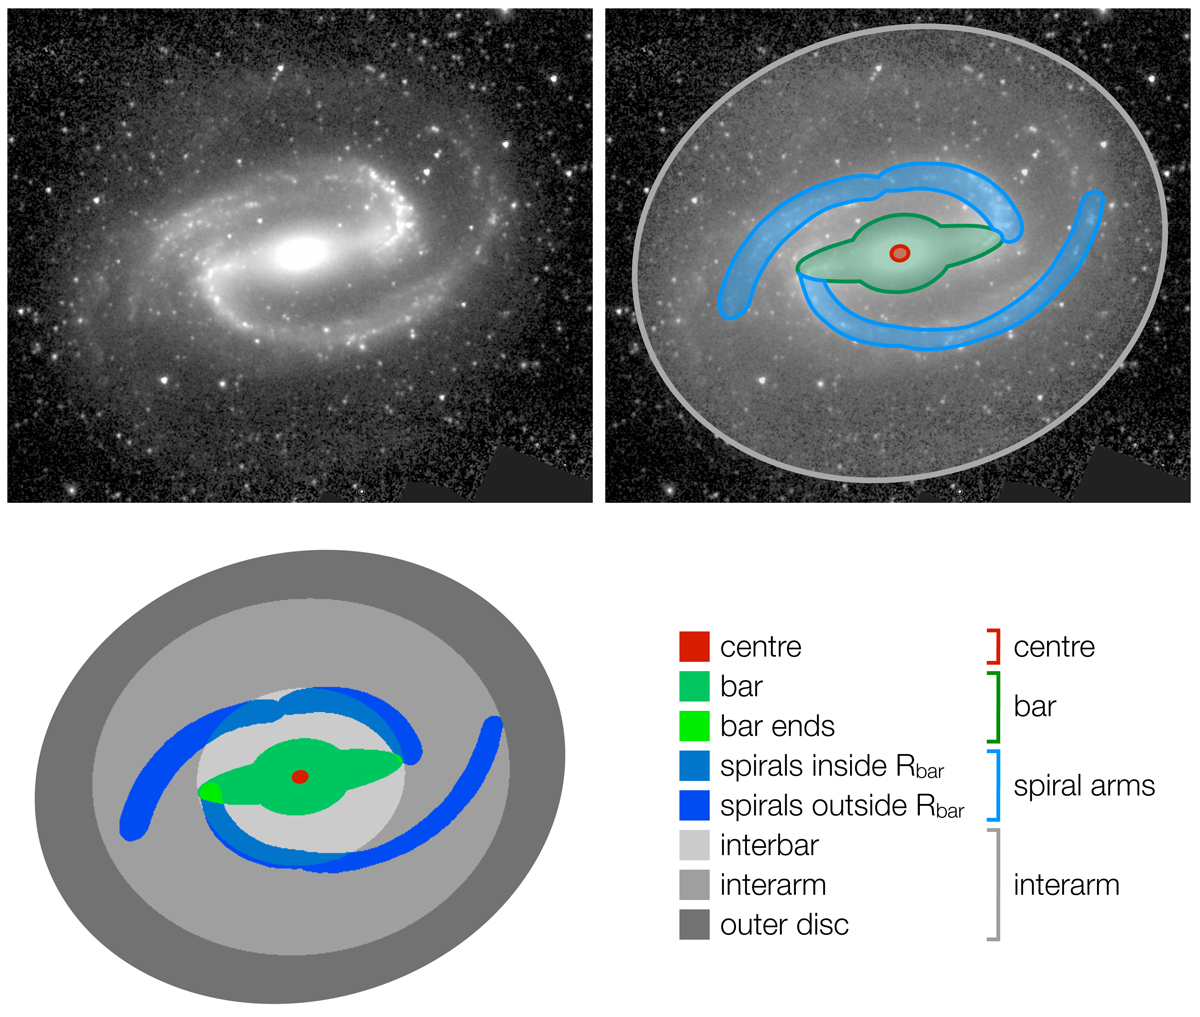
Notation used in the ‘simple’ masks, where each pixel is uniquely assigned to a dominant environment. The background image is the Spitzer 3.6 μm map of NGC 1300 and the different colours denote different environments. Several of these environments can be grouped together for further simplicity, as indicated in the bottom-right diagram and in Table 1.
Current usage metrics show cumulative count of Article Views (full-text article views including HTML views, PDF and ePub downloads, according to the available data) and Abstracts Views on Vision4Press platform.
Data correspond to usage on the plateform after 2015. The current usage metrics is available 48-96 hours after online publication and is updated daily on week days.
Initial download of the metrics may take a while.