Fig. B.1.
Download original image
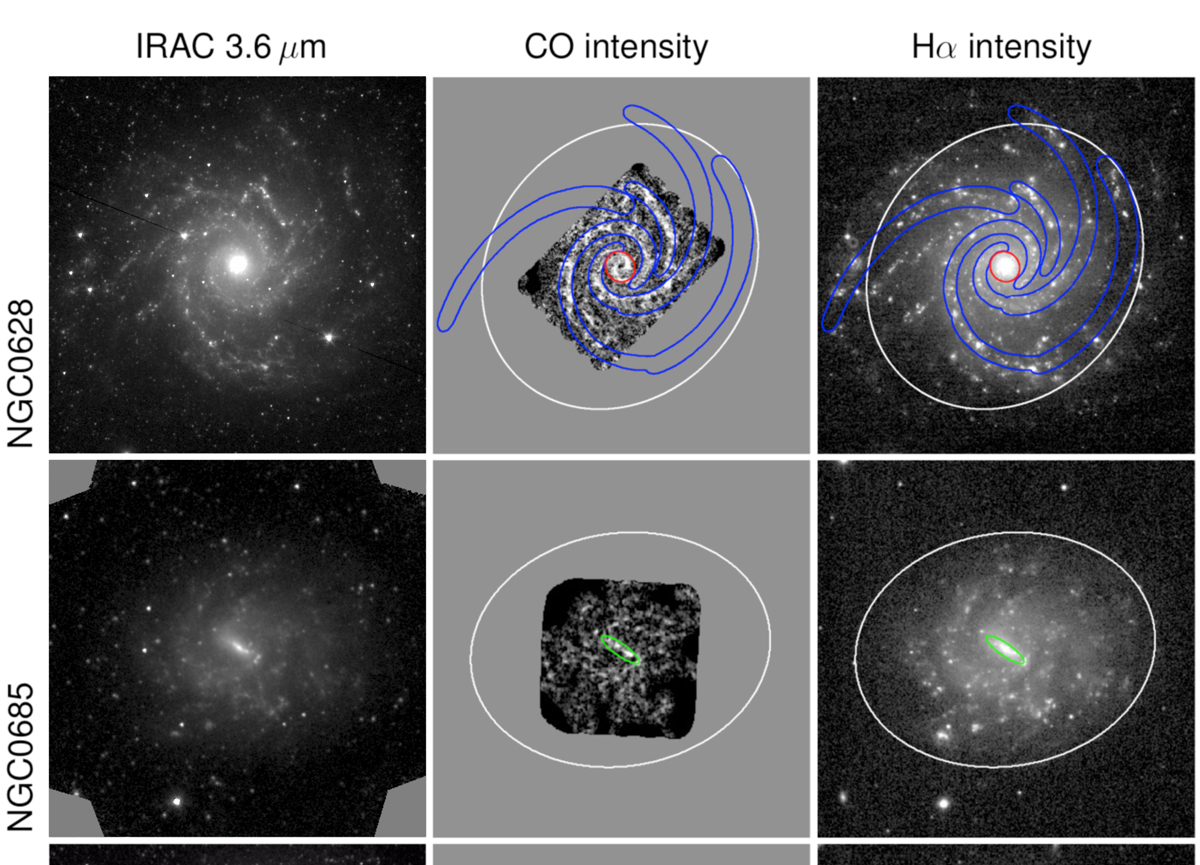
First two rows of the online-only figure showing the atlas of galaxies with environmental masks. Left: Spitzer 3.6 μm images, in a square root stretch ([0, 2.5] MJy sr−1). The environmental masks are defined based on this NIR emission. Middle: CO(2–1) emission (strict moment map combining ALMA 12 m and 7 m arrays, as well as Total Power); shown in square root stretch ([0, 10] K km s−1). Right: Hα emission, shown in square root stretch. The middle and right panels are overlaid with contours for the environments, with the same colour-coding as in the paper (red = centre; green = bar; blue = spiral arms; white = galaxy disc).
Current usage metrics show cumulative count of Article Views (full-text article views including HTML views, PDF and ePub downloads, according to the available data) and Abstracts Views on Vision4Press platform.
Data correspond to usage on the plateform after 2015. The current usage metrics is available 48-96 hours after online publication and is updated daily on week days.
Initial download of the metrics may take a while.