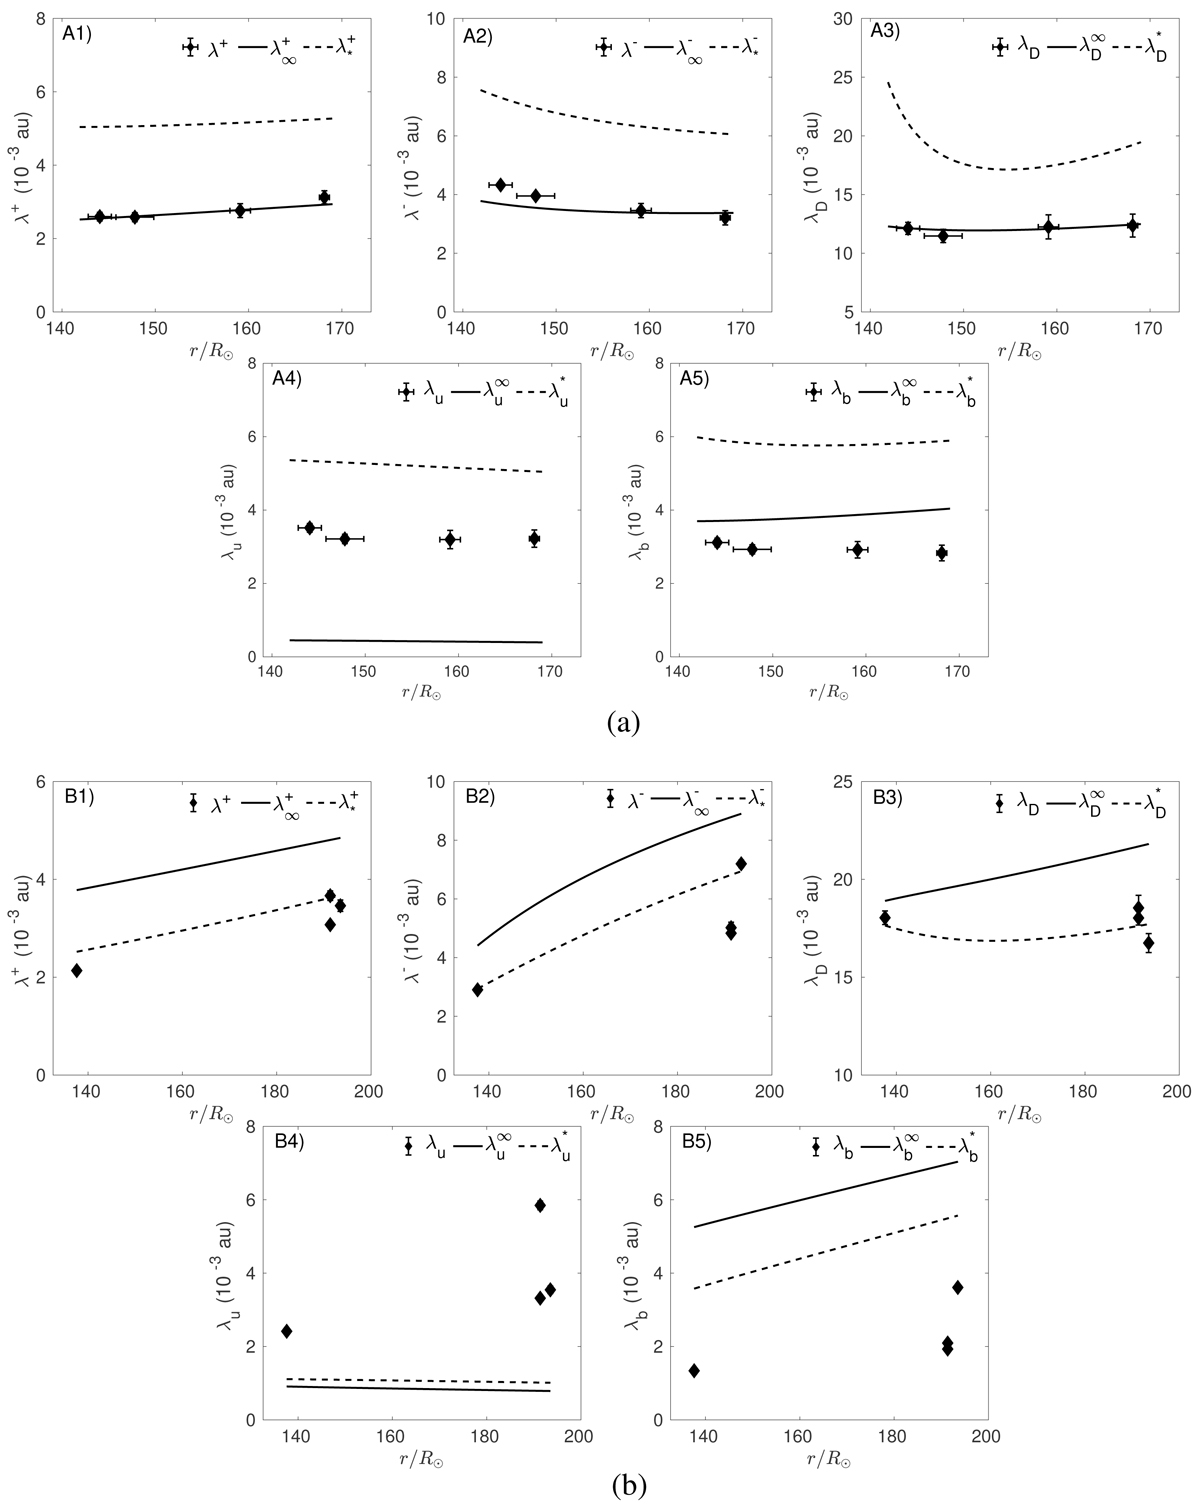
Fig. 4.
Download original image
Comparison between the theoretical and observed correlation lengths corresponding to energy in forward propagating modes (A1/B1), energy in backward propagating modes (A2/B2), residual energy (A3/B3), fluctuating kinetic energy (A4/B4), and fluctuating magnetic energy (A5/B4) as a function of the heliocentric distance. The solid curve show the correlation length corresponding to 2D turbulence. The dashed curve shows the correlation length of slab turbulence. The scatter plot with an error bar shows the observed correlation length. (a) Slow solar wind. (b) Fast solar wind.
Current usage metrics show cumulative count of Article Views (full-text article views including HTML views, PDF and ePub downloads, according to the available data) and Abstracts Views on Vision4Press platform.
Data correspond to usage on the plateform after 2015. The current usage metrics is available 48-96 hours after online publication and is updated daily on week days.
Initial download of the metrics may take a while.