Fig. 3.

Download original image
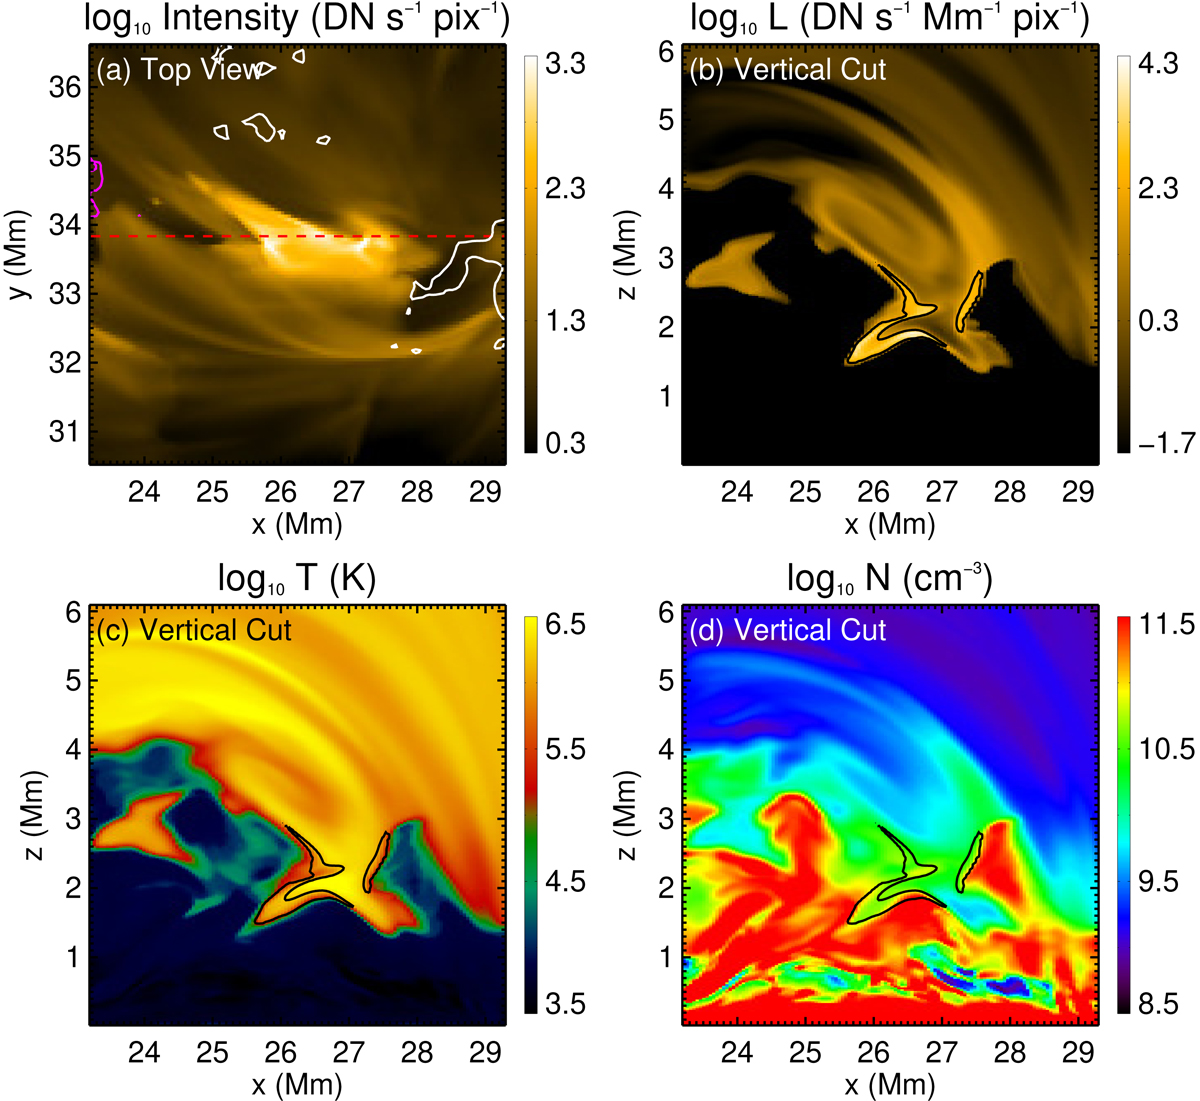
Thermal structure in a modeled campfire. Panel a: synthesized emission in the EUI 174 Å channel as seen from above. The field of view corresponds to the red box in Fig. 2. The purple and white contours correspond to vertical magnetic fields at ±1000 G in the photosphere. Panels b–d: vertical cuts through the campfire at the y position indicated by the dashed line in panel a. The cut of the radiative losses per volume in the 174 Å band is plotted in panel b. The black contours outline the regions of enhanced radiation. These contours are also overplotted on the temperature (panel c) and number density (panel d) in order to read off the temperature and density in the campfire. The event shown here is the same as the one shown in Fig. 4c. The temporal evolution of the emission from this campfire is displayed in panel 4c of Fig. B.1. See Sect. 3.2.
Current usage metrics show cumulative count of Article Views (full-text article views including HTML views, PDF and ePub downloads, according to the available data) and Abstracts Views on Vision4Press platform.
Data correspond to usage on the plateform after 2015. The current usage metrics is available 48-96 hours after online publication and is updated daily on week days.
Initial download of the metrics may take a while.


