Fig. 2.
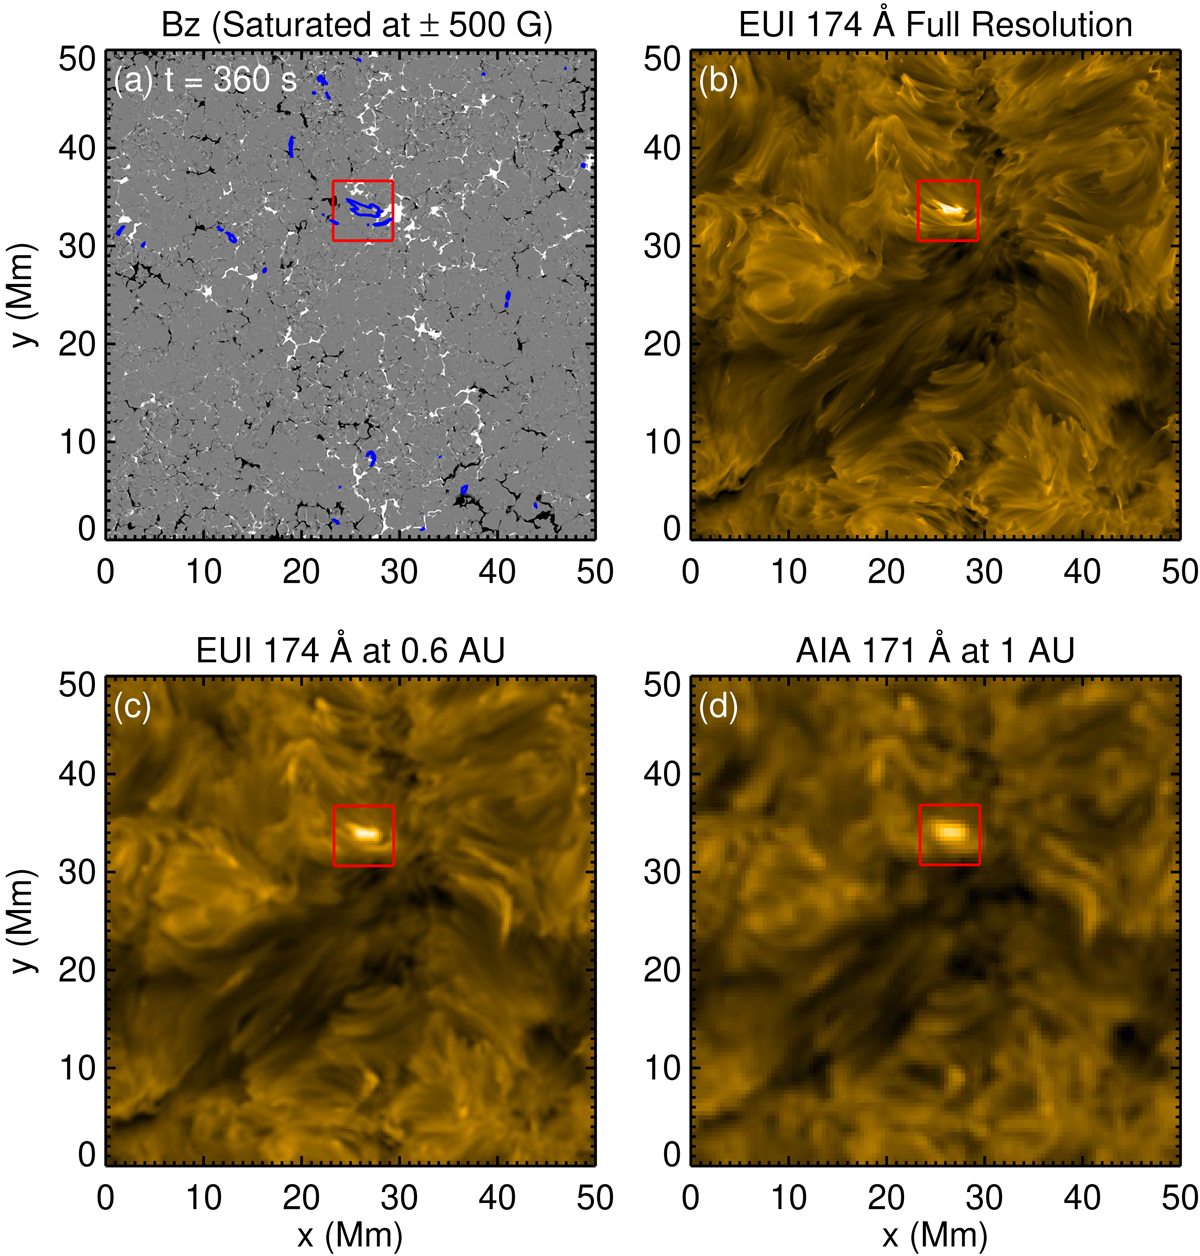
Download original image
Photospheric magnetic field and coronal emission in a 3D MHD model. Panel a: vertical component of the photospheric magnetic field saturated at ±500 G. This would correspond to a magnetogram at the disk center. Panel b: coronal emission in the 174 Å band integrated along the vertical direction at the full resolution of the numerical model (50 km grid spacing in the horizontal directions). Contours of regions with an EUV intensity of 5σ above the average intensity are overplotted in blue on the magnetogram in panel a in order to relate bright patches to the magnetic structure. Panel c: same emission in the EUI band as in panel b, but now degraded to a spatial resolution similar to EUI at 0.6 AU (ca. 200 km per pixel plate scale). For comparison, panel d: we show how AIA would see the model at 171 Å, that is, we reduced the resolution to match AIA (plate scale of ca. 450 km per pixel). The EUV images are shown on a logarithmic scale over a dynamic range of 1000. These panels show the full horizontal extent of the computational domain at one single snapshot. The red box highlights one coronal brightening that is discussed in more detail in Fig. 3. An animation is available online. See Sect. 3.2.
Current usage metrics show cumulative count of Article Views (full-text article views including HTML views, PDF and ePub downloads, according to the available data) and Abstracts Views on Vision4Press platform.
Data correspond to usage on the plateform after 2015. The current usage metrics is available 48-96 hours after online publication and is updated daily on week days.
Initial download of the metrics may take a while.