Fig. 1.

Download original image
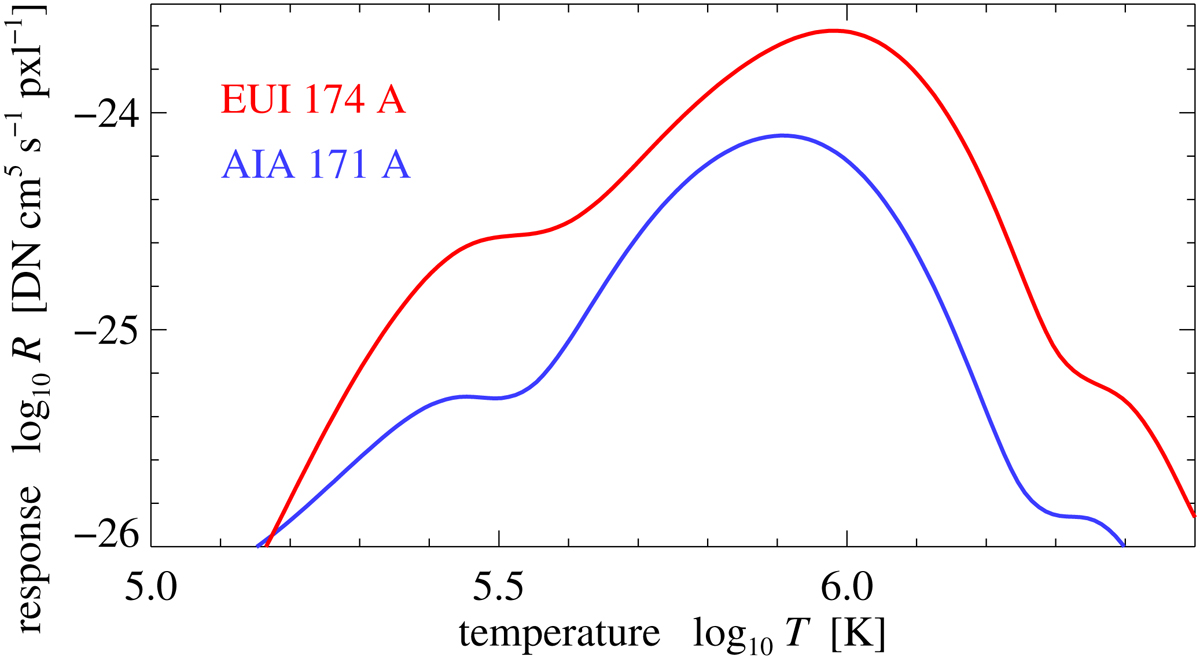
Temperature response, or contribution, function R(T, n). The red line shows the response for the EUI channel at 174 Å, and the blue line corresponds to the one for AIA at 171 Å. Both responses are shown here for a density of n = 109 cm−3, which is typical for coronal loops. The radiative losses (per volume) in the respective band are given by n2R. See Sect. 2.2.
Current usage metrics show cumulative count of Article Views (full-text article views including HTML views, PDF and ePub downloads, according to the available data) and Abstracts Views on Vision4Press platform.
Data correspond to usage on the plateform after 2015. The current usage metrics is available 48-96 hours after online publication and is updated daily on week days.
Initial download of the metrics may take a while.


