Fig. 3.
Download original image
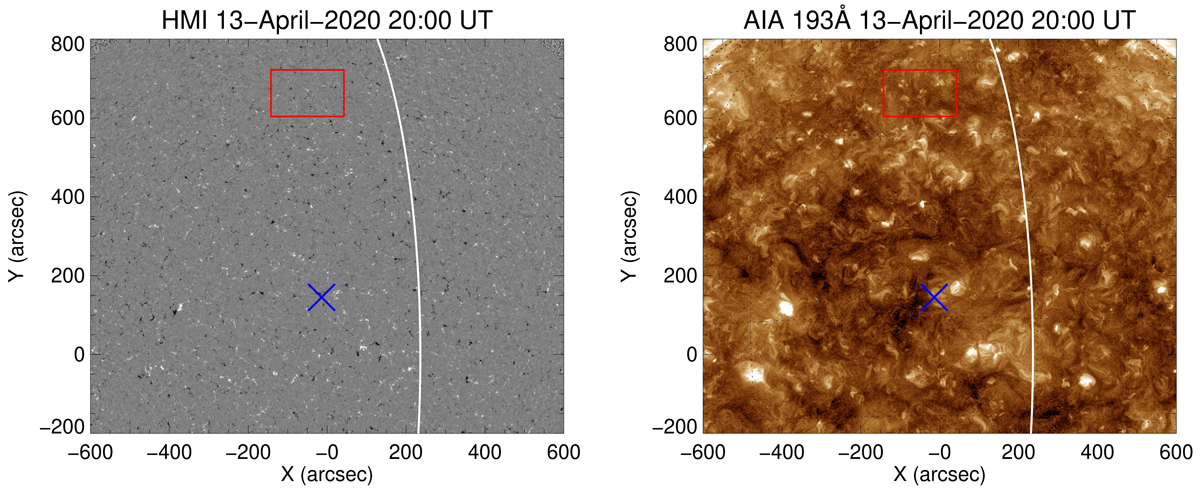
Left: HMI image at 20:00 UT 13 April 2020, showing the magnetic field just before the cavity began to rise. The blue ‘X’ marks the location of the GCS approximated source region, whilst the red box marks the approximate location of the cavity that was observed at the solar limb. Right: corresponding AIA 193 Å image, with the GCS and cavity regions being highlighted as before. In both figures, the limb of EUVI-A is over-plotted as the white line.
Current usage metrics show cumulative count of Article Views (full-text article views including HTML views, PDF and ePub downloads, according to the available data) and Abstracts Views on Vision4Press platform.
Data correspond to usage on the plateform after 2015. The current usage metrics is available 48-96 hours after online publication and is updated daily on week days.
Initial download of the metrics may take a while.