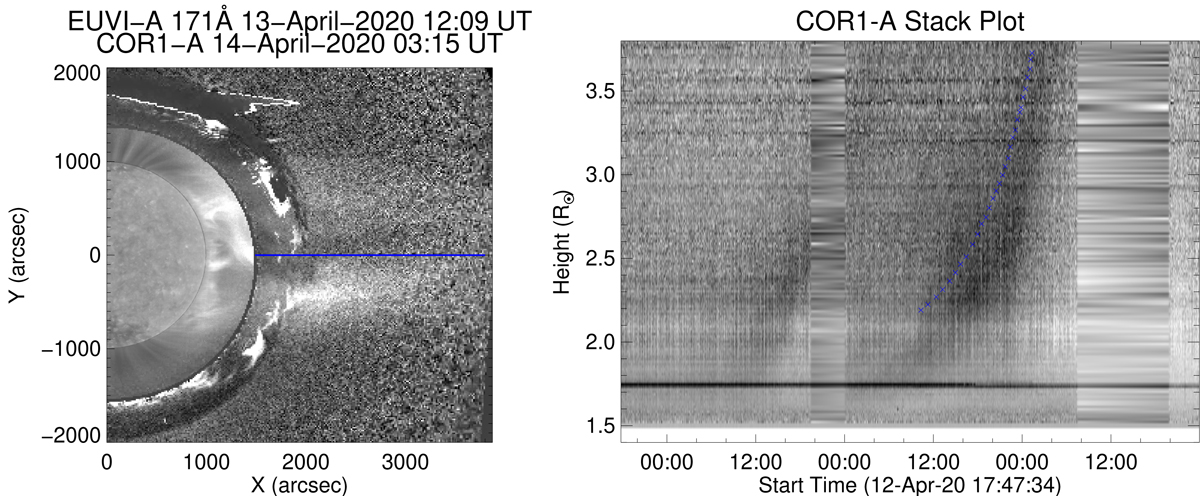
Fig. 2.

Download original image
Left: combined EUVI-A 171 Å and COR1-A, illustrating the connectivity between the high altitude structures observed in EUVI-A and the CME observed in COR1-A. The EUVI-A image was taken at 22:09 UT 13 April 2020, when the cavity was observed, whilst the COR1-A image was taken at 03:15 UT 14 April 2020, when the CME eruption was underway. The blue line represents the 90° slice taken for the stack plot. Right: stack plot inverse image of COR1-A, taken at an angle of 90°, showing the CME curve. The blue crosses indicate the points selected to track the CME curve.
Current usage metrics show cumulative count of Article Views (full-text article views including HTML views, PDF and ePub downloads, according to the available data) and Abstracts Views on Vision4Press platform.
Data correspond to usage on the plateform after 2015. The current usage metrics is available 48-96 hours after online publication and is updated daily on week days.
Initial download of the metrics may take a while.


